years = DATA['Year'].values
years_ve = years
years_ea = years
years_ma = years
years_ti = years
years_ur = years
years_ne = years
years_ge = years
years_ju = years
years_sa = years
ve_index_to_remove=np.array([0])
ea_index_to_remove=np.array([0])
ma_index_to_remove=np.array([0])
ti_index_to_remove=np.array([0])
ur_index_to_remove=np.array([0])
ne_index_to_remove=np.array([0])
ge_index_to_remove=np.array([0])
ju_index_to_remove=np.array([0])
sa_index_to_remove=np.array([0])
for i in range(0,len(years)):
if tclass[i] != 'Venus':
ve_index_to_remove=np.append(ve_index_to_remove,i)
for i in range(0,len(years)):
if tclass[i] != 'Earth':
ea_index_to_remove=np.append(ea_index_to_remove,i)
for i in range(0,len(years)):
if tclass[i] != 'Mars':
ma_index_to_remove=np.append(ma_index_to_remove,i)
for i in range(0,len(years)):
if tclass[i] != 'Titan':
ti_index_to_remove=np.append(ti_index_to_remove,i)
for i in range(0,len(years)):
if tclass[i] != 'Uranus':
ur_index_to_remove=np.append(ur_index_to_remove,i)
for i in range(0,len(years)):
if tclass[i] != 'Neptune':
ne_index_to_remove=np.append(ne_index_to_remove,i)
for i in range(0,len(years)):
if tclass[i] != 'Generic':
ge_index_to_remove=np.append(ge_index_to_remove,i)
ve_index_to_remove=np.delete(ve_index_to_remove,0)
ea_index_to_remove=np.delete(ea_index_to_remove,0)
ma_index_to_remove=np.delete(ma_index_to_remove,0)
ti_index_to_remove=np.delete(ti_index_to_remove,0)
ur_index_to_remove=np.delete(ur_index_to_remove,0)
ne_index_to_remove=np.delete(ne_index_to_remove,0)
ge_index_to_remove=np.delete(ge_index_to_remove,0)
years_ve = np.delete(years_ve, ve_index_to_remove)
years_ea = np.delete(years_ea, ea_index_to_remove)
years_ma = np.delete(years_ma, ma_index_to_remove)
years_ti = np.delete(years_ti, ti_index_to_remove)
years_ur = np.delete(years_ur, ur_index_to_remove)
years_ne = np.delete(years_ne, ne_index_to_remove)
years_ge = np.delete(years_ge, ge_index_to_remove)
years_st = [years_ve, years_ea, years_ma, years_ti, years_ur, years_ne, years_ge]
fig=plt.figure(figsize=(6.5,3.25))
from matplotlib import rcParams
fig = plt.figure(figsize=(6.5, 3.5))
plt.rc('font',family='Times New Roman')
params = {'mathtext.default': 'regular' }
plt.rcParams.update(params)
colors = ['xkcd:light orange', 'xkcd:rust', 'xkcd:red orange', 'xkcd:sunshine yellow', 'xkcd:bright sea green', 'xkcd:cerulean blue', 'xkcd:grey']
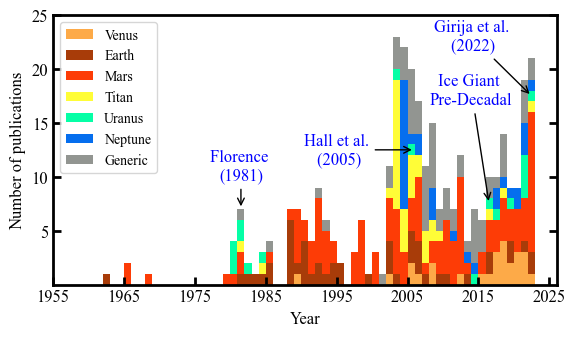
plt.hist(years_st, bins=np.arange(min(years), max(years)+2, 1), stacked=True, label=['Venus', 'Earth', 'Mars','Titan', 'Uranus', 'Neptune', 'Generic'],color=colors)
plt.xlabel('Year', fontsize=12)
plt.ylabel('Number of publications',fontsize=12);
plt.xticks(np.arange(1955, max(years) + 10, 10))
plt.yticks(np.arange(5, 25 + 1, 5))
plt.xticks(fontsize=12)
plt.yticks(fontsize=12)
ax = plt.gca()
ax.tick_params(direction='in')
ax.yaxis.set_ticks_position('both')
plt.annotate("Florence \n(1981)" , xy=(1981.5, 7), xytext=(1981.5, 11), va="center", ha="center", arrowprops=dict(arrowstyle='->, head_width=0.2', facecolor='blue'), fontsize=12,color='blue',bbox=dict(boxstyle='round,pad=0.2', fc='none', ec='none', alpha=0.3))
plt.annotate("Hall et al.\n (2005)" , xy=(2006, 12.5), xytext=(1995,12.5), va="center", ha="center", arrowprops=dict(arrowstyle='->, head_width=0.2', facecolor='blue'), fontsize=12,color='blue',bbox=dict(boxstyle='round,pad=0.2', fc='none', ec='none', alpha=0.3))
plt.annotate("Ice Giant \nPre-Decadal" , xy=(2016.5, 7.5), xytext=(2014,18), va="center", ha="center", arrowprops=dict(arrowstyle='->, head_width=0.2', facecolor='blue'), fontsize=12,color='blue',bbox=dict(boxstyle='round,pad=0.2', fc='none', ec='none', alpha=0.3))
plt.annotate("Girija et al.\n (2022)" , xy=(2022.5, 17.5), xytext=(2014,23), va="center", ha="center", arrowprops=dict(arrowstyle='->, head_width=0.2', facecolor='blue'), fontsize=12,color='blue',bbox=dict(boxstyle='round,pad=0.2', fc='none', ec='none', alpha=0.3))
ax = plt.gca()
ax.tick_params(direction='in')
plt.legend(loc='upper left', fontsize=10)
ax.xaxis.set_tick_params(width=2)
ax.yaxis.set_tick_params(width=2)
ax.tick_params(length=6)
for axis in ['top','bottom','left','right']:
ax.spines[axis].set_linewidth(2)
plt.savefig('../../../data/acta-astronautica/uranus-orbiter-probe/hist-byPlanet-uranus-paper.png',bbox_inches='tight')
plt.savefig('../../../data/acta-astronautica/uranus-orbiter-probe/hist-byPlanet-uranus-paper.pdf', dpi=500,bbox_inches='tight')
plt.savefig('../../../data/acta-astronautica/uranus-orbiter-probe/hist-byPlanet-uranus-paper.eps', dpi=500,bbox_inches='tight')
plt.show()