# plot overshoot and undershoot trajectories
fig = plt.figure()
fig = plt.figure()
fig.set_size_inches([8.25,6.25])
plt.rc('font',family='Times New Roman')
params = {'mathtext.default': 'regular' }
plt.rcParams.update(params)
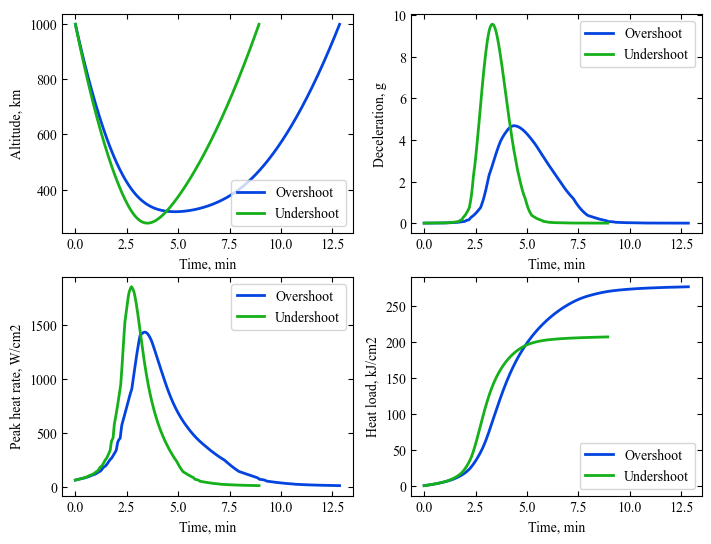
plt.subplot(2, 2, 1)
plt.plot(t_min_os , h_km_os, linestyle='solid' , color='xkcd:blue',linewidth=2.0, label='Overshoot')
plt.plot(t_min_us , h_km_us, linestyle='solid' , color='xkcd:green',linewidth=2.0, label='Undershoot')
plt.xlabel('Time, min',fontsize=10)
plt.ylabel("Altitude, km",fontsize=10)
ax = plt.gca()
ax.tick_params(direction='in')
ax.yaxis.set_ticks_position('both')
ax.xaxis.set_ticks_position('both')
plt.tick_params(direction='in')
plt.tick_params(axis='x',labelsize=10)
plt.tick_params(axis='y',labelsize=10)
plt.legend(loc='lower right', fontsize=10)
plt.subplot(2, 2, 2)
plt.plot(t_min_os , acc_net_g_os , linestyle='solid' , color='xkcd:blue',linewidth=2.0, label='Overshoot')
plt.plot(t_min_us , acc_net_g_us, linestyle='solid' , color='xkcd:green',linewidth=2.0, label='Undershoot')
plt.xlabel('Time, min',fontsize=10)
plt.ylabel("Deceleration, g",fontsize=10)
ax = plt.gca()
ax.tick_params(direction='in')
ax.yaxis.set_ticks_position('both')
ax.xaxis.set_ticks_position('both')
plt.tick_params(direction='in')
plt.tick_params(axis='x',labelsize=10)
plt.tick_params(axis='y',labelsize=10)
plt.legend(loc='upper right', fontsize=10)
plt.subplot(2, 2, 3)
plt.plot(t_min_os , q_stag_con_os+q_stag_rad_os, linestyle='solid' , color='xkcd:blue',linewidth=2.0, label='Overshoot')
plt.plot(t_min_us , q_stag_con_us+q_stag_rad_us, linestyle='solid' , color='xkcd:green',linewidth=2.0, label='Undershoot')
plt.xlabel('Time, min',fontsize=10)
plt.ylabel("Peak heat rate, W/cm2",fontsize=10)
ax = plt.gca()
ax.tick_params(direction='in')
ax.yaxis.set_ticks_position('both')
ax.xaxis.set_ticks_position('both')
plt.tick_params(direction='in')
plt.tick_params(axis='x',labelsize=10)
plt.tick_params(axis='y',labelsize=10)
plt.legend(loc='upper right', fontsize=10)
plt.subplot(2, 2, 4)
plt.plot(t_min_os , heatload_os/1e3 , linestyle='solid' , color='xkcd:blue',linewidth=2.0, label='Overshoot')
plt.plot(t_min_us , heatload_us/1e3, linestyle='solid' , color='xkcd:green',linewidth=2.0, label='Undershoot')
plt.xlabel('Time, min',fontsize=10)
plt.ylabel("Heat load, kJ/cm2",fontsize=10)
ax = plt.gca()
ax.tick_params(direction='in')
ax.yaxis.set_ticks_position('both')
ax.xaxis.set_ticks_position('both')
plt.tick_params(direction='in')
plt.tick_params(axis='x',labelsize=10)
plt.tick_params(axis='y',labelsize=10)
plt.legend(loc='lower right', fontsize=10)
plt.savefig('../../../data/acta-astronautica/uranus-orbiter-probe/uranus-ac-limiting-trajectories.png', dpi= 300,bbox_inches='tight')
plt.savefig('../../../data/acta-astronautica/uranus-orbiter-probe/uranus-ac-limiting-trajectories.pdf', dpi=300,bbox_inches='tight')
plt.savefig('../../../data/acta-astronautica/uranus-orbiter-probe/uranus-ac-limiting-trajectories.eps', dpi=300,bbox_inches='tight')
plt.show()