fig = plt.figure()
fig.set_size_inches([6.5, 3.25])
plt.rc('font',family='Times New Roman')
params = {'mathtext.default': 'regular' }
plt.rcParams.update(params)
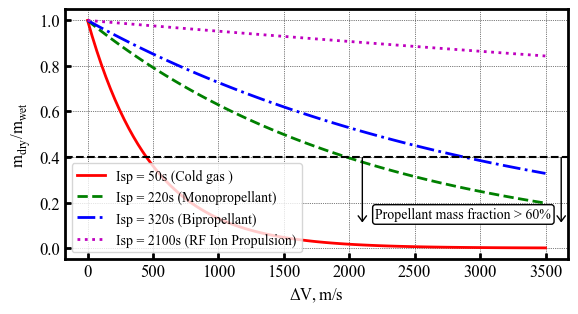
plt.plot(DV_array, mf_m0_array_1, linestyle='solid', color='r', linewidth=2.0, label="Isp = 50s (Cold gas )")
plt.plot(DV_array, mf_m0_array_2, linestyle='dashed', color='g', linewidth=2.0, label="Isp = 220s (Monopropellant)")
plt.plot(DV_array, mf_m0_array_3, linestyle='dashdot', color='b', linewidth=2.0, label="Isp = 320s (Bipropellant)")
plt.plot(DV_array, mf_m0_array_4, linestyle='dotted', color='m', linewidth=2.0, label="Isp = 2100s (RF Ion Propulsion)")
plt.xlabel(r"$\Delta V, m/s$",fontsize=12)
plt.ylabel(r'$m_{dry} / m_{wet}$',fontsize=12)
#plt.xscale('log')
plt.xticks(fontsize=12)
plt.yticks(fontsize=12)
#plt.xticks(np.logspace(-9, -1, 9), fontsize=12)
plt.grid('on',linestyle='-', linewidth=0.2)
plt.axhline(y=0.4, linestyle='dashed', linewidth=1.5, color='k')
plt.text(2200, 0.13, 'Propellant mass fraction > 60%', color='xkcd:black', fontsize=10,
bbox=dict(boxstyle='round,pad=0.2', fc='w', ec='k', alpha=1))
plt.annotate("" , xy=(2100, 0.10), xytext=(2100, 0.41),
va="center", ha="center",
arrowprops=dict(arrowstyle='->, head_width=0.3', facecolor='blue'), fontsize=10,color='k')
plt.annotate("" , xy=(3620, 0.10), xytext=(3620, 0.41),
va="center", ha="center",
arrowprops=dict(arrowstyle='->, head_width=0.3', facecolor='blue'), fontsize=10,color='k')
ax=plt.gca()
ax.xaxis.set_tick_params(direction='in', which='both')
ax.yaxis.set_tick_params(direction='in', which='both')
ax.xaxis.set_tick_params(width=2, length=4)
ax.yaxis.set_tick_params(width=2, length=4)
ax.xaxis.set_tick_params(width=1, length=4, which='minor')
ax.yaxis.set_tick_params(width=1, length=4, which='minor')
ax.xaxis.grid(which='major', color='k', linestyle='dotted', linewidth=0.5)
ax.xaxis.grid(which='minor', color='k', linestyle='dotted', linewidth=0.0)
ax.yaxis.grid(which='major', color='k', linestyle='dotted', linewidth=0.5)
ax.yaxis.grid(which='minor', color='k', linestyle='dotted', linewidth=0.0)
for axis in ['top', 'bottom', 'left', 'right']:
ax.spines[axis].set_linewidth(2)
plt.legend(loc='lower left', fontsize=10, framealpha=0.8)
plt.savefig('../../../data/mdpi-aerospace/smallsat-mission-concepts/propellant-mass-fraction.png', dpi= 300,bbox_inches='tight')
plt.savefig('../../../data/mdpi-aerospace/smallsat-mission-concepts/propellant-mass-fraction.pdf', dpi=300,bbox_inches='tight')
plt.savefig('../../../data/mdpi-aerospace/smallsat-mission-concepts/propellant-mass-fraction.eps', dpi=300,bbox_inches='tight')
plt.show()