fig = plt.figure()
fig.set_size_inches([4.25, 4.25])
plt.rc('font',family='Times New Roman')
params = {'mathtext.default': 'regular' }
plt.rcParams.update(params)
theta_arr = np.linspace(0, 2*np.pi, 101)
X_MARS = approach1.planetObj.RP*np.cos(theta_arr)/1e6
Y_MARS = approach1.planetObj.RP*np.sin(theta_arr)/1e6
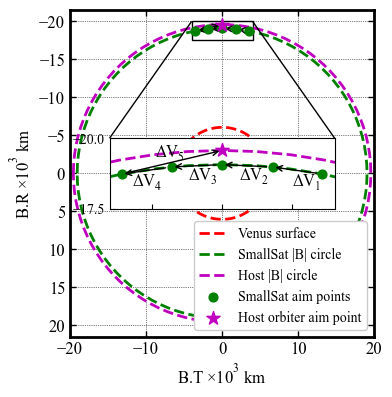
plt.plot(X_MARS, Y_MARS, color='red', linestyle='dashed', linewidth=2.0, label='Venus surface')
BR1 = np.dot(approach1.b_mag*approach1.B_vec_bi_unit, approach1.R_vec_bi_unit)
BT1 = np.dot(approach1.b_mag*approach1.B_vec_bi_unit, approach1.T_vec_bi_unit)
BR2 = np.dot(approach2.b_mag*approach2.B_vec_bi_unit, approach2.R_vec_bi_unit)
BT2 = np.dot(approach2.b_mag*approach2.B_vec_bi_unit, approach2.T_vec_bi_unit)
BR3 = np.dot(approach3.b_mag*approach3.B_vec_bi_unit, approach3.R_vec_bi_unit)
BT3 = np.dot(approach3.b_mag*approach3.B_vec_bi_unit, approach3.T_vec_bi_unit)
BR4 = np.dot(approach4.b_mag*approach4.B_vec_bi_unit, approach4.R_vec_bi_unit)
BT4 = np.dot(approach4.b_mag*approach4.B_vec_bi_unit, approach4.T_vec_bi_unit)
BR5 = np.dot(approach5.b_mag*approach5.B_vec_bi_unit, approach5.R_vec_bi_unit)
BT5 = np.dot(approach5.b_mag*approach5.B_vec_bi_unit, approach5.T_vec_bi_unit)
BR6 = np.dot(space.b_mag*space.B_vec_bi_unit, space.R_vec_bi_unit)
BT6 = np.dot(space.b_mag*space.B_vec_bi_unit, space.T_vec_bi_unit)
X_SS = (BR3/1e6)*np.cos(theta_arr)
Y_SS = (BR3/1e6)*np.sin(theta_arr)
plt.plot(X_SS, Y_SS, color='g', linestyle='dashed', linewidth=2.0, label='SmallSat |B| circle')
X_HS = (BR6/1e6)*np.cos(theta_arr)
Y_HS = (BR6/1e6)*np.sin(theta_arr)
plt.plot(X_HS, Y_HS, color='m', linestyle='dashed', linewidth=2.0, label='Host |B| circle')
plt.scatter(BT1/1e6, BR1/1e6, marker="o", s=40, color='g', zorder=100, label='SmallSat aim points')
plt.scatter(BT2/1e6, BR2/1e6, marker="o", s=40, color='g', zorder=100)
plt.scatter(BT3/1e6, BR3/1e6, marker="o", s=40, color='g', zorder=100)
plt.scatter(BT4/1e6, BR4/1e6, marker="o", s=40, color='g', zorder=100)
plt.scatter(BT5/1e6, BR5/1e6, marker="o", s=40, color='g', zorder=100)
plt.scatter(BT6/1e6, BR6/1e6, marker="*", s=100, color='m', zorder=100, label='Host orbiter aim point')
plt.gca().invert_yaxis()
plt.gca().set_aspect('equal')
plt.xlabel('B.T '+r'$\times 10^3$'+ ' km' ,fontsize=12)
plt.ylabel('B.R '+r'$\times 10^3$'+ ' km' ,fontsize=12)
plt.yticks(fontsize=12)
plt.xticks(fontsize=12)
ax = plt.gca()
ax.tick_params(direction='in')
ax.yaxis.set_ticks_position('both')
ax.xaxis.set_ticks_position('both')
ax.set_zorder(1)
ax=plt.gca()
ax.xaxis.set_tick_params(direction='in', which='both')
ax.yaxis.set_tick_params(direction='in', which='both')
ax.xaxis.set_tick_params(width=1, length=4)
ax.yaxis.set_tick_params(width=1, length=4)
ax.xaxis.set_tick_params(width=1, length=4, which='minor')
ax.yaxis.set_tick_params(width=1, length=4, which='minor')
ax.xaxis.grid(which='major', color='k', linestyle='dotted', linewidth=0.5)
ax.xaxis.grid(which='minor', color='k', linestyle='dotted', linewidth=0.0)
ax.yaxis.grid(which='major', color='k', linestyle='dotted', linewidth=0.5)
ax.yaxis.grid(which='minor', color='k', linestyle='dotted', linewidth=0.0)
plt.annotate('', xy=(BT2/1e6, BR2/1e6), xytext=(BT1/1e6, BR1/1e6),
va="center", ha="center",
arrowprops=dict(arrowstyle='->, head_width=0.2', facecolor='blue'), fontsize=10, color='k',
bbox=dict(boxstyle='round,pad=0.2', fc='w', ec='k', alpha=1))
plt.annotate('', xy=(BT3/1e6, BR3/1e6), xytext=(BT2/1e6, BR2/1e6),
va="center", ha="center",
arrowprops=dict(arrowstyle='->, head_width=0.2', facecolor='blue'), fontsize=10, color='k',
bbox=dict(boxstyle='round,pad=0.2', fc='w', ec='k', alpha=1))
plt.annotate('', xy=(BT4/1e6, BR4/1e6), xytext=(BT3/1e6, BR3/1e6),
va="center", ha="center",
arrowprops=dict(arrowstyle='->, head_width=0.2', facecolor='blue'), fontsize=10, color='k',
bbox=dict(boxstyle='round,pad=0.2', fc='w', ec='k', alpha=1))
plt.annotate('', xy=(BT5/1e6, BR5/1e6), xytext=(BT4/1e6, BR4/1e6),
va="center", ha="center",
arrowprops=dict(arrowstyle='->, head_width=0.2', facecolor='blue'), fontsize=10, color='k',
bbox=dict(boxstyle='round,pad=0.2', fc='w', ec='k', alpha=1))
plt.annotate('', xy=(BT6/1e6, BR6/1e6), xytext=(BT5/1e6, BR5/1e6),
va="center", ha="center",
arrowprops=dict(arrowstyle='->, head_width=0.2', facecolor='blue'), fontsize=10, color='k',
bbox=dict(boxstyle='round,pad=0.2', fc='w', ec='k', alpha=1))
#plt.text(5800, -1000, r'$\Delta V_1$', fontsize=14)
#plt.text(4700, -3500, r'$\Delta V_2$', fontsize=14)
#plt.text(3000, -5500, r'$\Delta V_3$', fontsize=14)
#plt.text(1000, -6200, r'$\Delta V_4$', fontsize=14)
#plt.text(-1500, -7200, r'$\Delta V_5$', fontsize=14)
for axis in ['top', 'bottom', 'left', 'right']:
ax.spines[axis].set_linewidth(2)
plt.xlim([-20, 20])
#plt.ylim([-22, 0])
axins = zoomed_inset_axes(ax, 3.7 ,loc=10, axes_kwargs={'zorder':2})
axins.set_xlim(-4,4)
axins.set_ylim(-20, -17.5)
axins.plot(X_SS, Y_SS, color='g', linestyle='dashed', linewidth=2.0)
axins.plot(X_HS, Y_HS, color='m', linestyle='dashed', linewidth=2.0)
axins.scatter(BT1/1e6, BR1/1e6, marker="o", s=40, color='g', zorder=1)
axins.scatter(BT2/1e6, BR2/1e6, marker="o", s=40, color='g', zorder=1)
axins.scatter(BT3/1e6, BR3/1e6, marker="o", s=40, color='g', zorder=1)
axins.scatter(BT4/1e6, BR4/1e6, marker="o", s=40, color='g', zorder=1)
axins.scatter(BT5/1e6, BR5/1e6, marker="o", s=40, color='g', zorder=1)
axins.scatter(BT6/1e6, BR6/1e6, marker="*", s=100, color='m', zorder=1)
axins.annotate('', xy=(BT2/1e6, BR2/1e6), xytext=(BT1/1e6, BR1/1e6),
va="center", ha="center",
arrowprops=dict(arrowstyle='->, head_width=0.2', facecolor='blue'), fontsize=10, color='k',
bbox=dict(boxstyle='round,pad=0.2', fc='w', ec='k', alpha=1))
axins.annotate('', xy=(BT3/1e6, BR3/1e6), xytext=(BT2/1e6, BR2/1e6),
va="center", ha="center",
arrowprops=dict(arrowstyle='->, head_width=0.2', facecolor='blue'), fontsize=10, color='k',
bbox=dict(boxstyle='round,pad=0.2', fc='w', ec='k', alpha=1))
axins.annotate('', xy=(BT4/1e6, BR4/1e6), xytext=(BT3/1e6, BR3/1e6),
va="center", ha="center",
arrowprops=dict(arrowstyle='->, head_width=0.2', facecolor='blue'), fontsize=10, color='k',
bbox=dict(boxstyle='round,pad=0.2', fc='w', ec='k', alpha=1))
axins.annotate('', xy=(BT5/1e6, BR5/1e6), xytext=(BT4/1e6, BR4/1e6),
va="center", ha="center",
arrowprops=dict(arrowstyle='->, head_width=0.2', facecolor='blue'), fontsize=10, color='k',
bbox=dict(boxstyle='round,pad=0.2', fc='w', ec='k', alpha=1))
axins.annotate('', xy=(BT6/1e6, BR6/1e6), xytext=(BT5/1e6, BR5/1e6),
va="center", ha="center",
arrowprops=dict(arrowstyle='->, head_width=0.2', facecolor='blue'), fontsize=10, color='k',
bbox=dict(boxstyle='round,pad=0.2', fc='w', ec='k', alpha=1))
#axins.scatter(BT5/1e3, BR5/1e3, marker="o", s=100, color='g')
#axins.scatter(BT6/1e3, BR6/1e3, marker="*", s=200, color='m')
axins.annotate('', xy=(BT6/1e3, 0.999*BR6/1e3), xytext=(BT5/1e3, BR5/1e3),
va="center", ha="center",
arrowprops=dict(arrowstyle='->, head_width=0.3', facecolor='blue'), fontsize=10, color='k',
bbox=dict(boxstyle='round,pad=0.2', fc='w', ec='k', alpha=1))
#axins.text(50, -7450, r'$\Delta V_5$', rotation=0, fontsize=12)
axins.invert_yaxis()
patch, pp1, pp2 = mark_inset(ax, axins,loc1=1,loc2=1, fc="none", ec="k", linestyle='solid', linewidth = 1.0, zorder=-10)
pp1.loc1 = 1
pp1.loc2 = 4
pp2.loc1 = 2
pp2.loc2 = 3
plt.draw()
axins.yaxis.get_major_locator().set_params(nbins=1)
axins.xaxis.get_major_locator().set_params(nbins=1)
plt.setp(axins.get_xticklabels(), visible=False)
plt.setp(axins.get_yticklabels(), visible=True)
axins.xaxis.set_tick_params(direction='in', which='both')
axins.yaxis.set_tick_params(direction='in', which='both')
axins.text(2.5, -18.3, r'$\Delta V_1$', rotation=0, fontsize=12)
axins.text(0.6, -18.5, r'$\Delta V_2$', rotation=0, fontsize=12)
axins.text(-1.2, -18.5, r'$\Delta V_3$', rotation=0, fontsize=12)
axins.text(-3.2, -18.3, r'$\Delta V_4$', rotation=0, fontsize=12)
axins.text(-2.4, -19.3, r'$\Delta V_5$', rotation=0, fontsize=12)
ax.legend(loc='lower right', fontsize=10, framealpha=1)
plt.savefig('../../../data/mdpi-aerospace/smallsat-mission-concepts/venus/venus-smallsat-const-b-plane.png', dpi= 300,bbox_inches='tight')
plt.savefig('../../../data/mdpi-aerospace/smallsat-mission-concepts/venus/venus-smallsat-const-b-plane.pdf', dpi=300,bbox_inches='tight')
plt.savefig('../../../data/mdpi-aerospace/smallsat-mission-concepts/venus/venus-smallsat-const-b-plane.eps', dpi=300,bbox_inches='tight')
plt.show()