fig = plt.figure()
fig.set_size_inches([6.25, 3.25])
plt.rc('font',family='Times New Roman')
params = {'mathtext.default': 'regular' }
plt.rcParams.update(params)
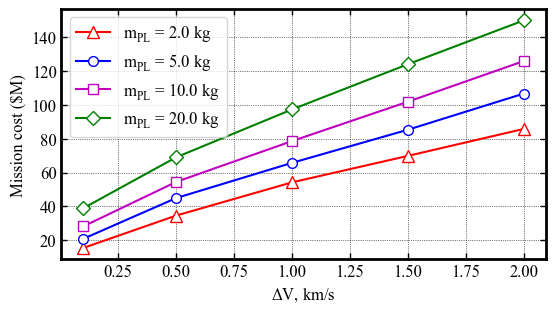
plt.plot(chem_DV, chem_data[1][1:], label=r'$m_{PL}$' +' = '+str(chem_data[1][0])+ ' kg', color='r', marker='^', mfc='w', markeredgewidth=1, markersize=8, linestyle='solid')
plt.plot(chem_DV, chem_data[4][1:], label=r'$m_{PL}$' +' = '+str(chem_data[4][0])+ ' kg', color='b', marker='o', mfc='w', markeredgewidth=1, markersize=7, linestyle='solid')
plt.plot(chem_DV, chem_data[9][1:], label=r'$m_{PL}$' +' = '+str(chem_data[9][0])+ ' kg', color='m', marker='s', mfc='w', markeredgewidth=1, markersize=7, linestyle='solid')
plt.plot(chem_DV, chem_data[19][1:], label=r'$m_{PL}$' +' = '+str(chem_data[19][0])+ ' kg', color='g', marker='D', mfc='w', markeredgewidth=1, markersize=7, linestyle='solid')
plt.xlabel(r'$\Delta V$'+', km/s', fontsize=12)
plt.ylabel('Mission cost ($M)', fontsize=12)
plt.yticks(fontsize=12)
plt.xticks(fontsize=12)
ax = plt.gca()
ax.tick_params(direction='in')
ax.yaxis.set_ticks_position('both')
ax.xaxis.set_ticks_position('both')
ax.set_zorder(1)
ax=plt.gca()
ax.xaxis.set_tick_params(direction='in', which='both')
ax.yaxis.set_tick_params(direction='in', which='both')
ax.xaxis.set_tick_params(width=1, length=4)
ax.yaxis.set_tick_params(width=1, length=4)
ax.xaxis.set_tick_params(width=1, length=4, which='minor')
ax.yaxis.set_tick_params(width=1, length=4, which='minor')
ax.xaxis.grid(which='major', color='k', linestyle='dotted', linewidth=0.5)
ax.xaxis.grid(which='minor', color='k', linestyle='dotted', linewidth=0.0)
ax.yaxis.grid(which='major', color='k', linestyle='dotted', linewidth=0.5)
ax.yaxis.grid(which='minor', color='k', linestyle='dotted', linewidth=0.0)
plt.legend(loc='upper left', fontsize=12)
for axis in ['top', 'bottom', 'left', 'right']:
ax.spines[axis].set_linewidth(2)
plt.savefig('../../../data/acta-astronautica/smallsat-mission-concepts/cost-assessment.png', dpi= 300,bbox_inches='tight')
plt.savefig('../../../data/acta-astronautica/smallsat-mission-concepts/cost-assessment.pdf', dpi=300,bbox_inches='tight')
plt.savefig('../../../data/acta-astronautica/smallsat-mission-concepts/cost-assessment.eps', dpi=300,bbox_inches='tight')
plt.show()