01 - Literature Survey
[1]:
import pandas as pd
import numpy as np
from pylab import *
import matplotlib.pyplot as plt
from collections import Counter
from matplotlib import rcParams
[2]:
DATA = pd.read_excel('../bibliometric-data/Bibliometric Data - Mar 12, 2020.xlsx', sheet_name='Sheet1')

years  = DATA['Year'].values
origin = DATA['Country of Origin'].values
planet = DATA['Targets'].values
tclass = DATA['Target Class'].values
source = DATA['Journal / Conference / Report'].values
author = DATA['Author Affiliation'].values
sponsor= DATA['Funding Organization'].values

publisher = DATA['Publisher'].values
C:\Users\AthulGirija\anaconda3\envs\env1\lib\site-packages\openpyxl\worksheet\_reader.py:312: UserWarning: Unknown extension is not supported and will be removed
  warn(msg)
[3]:
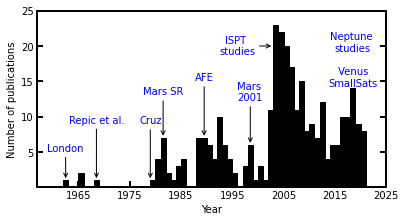
def create_histogramYears():

    fig = plt.figure()
    fig.set_size_inches([6.25,3.25])
    rcParams['font.family'] = 'sans-serif'
    rcParams['font.sans-serif'] = ['DejaVu Sans']
    params = {'mathtext.default': 'regular' }
    plt.rcParams.update(params)

    plt.hist(years, bins=np.arange(min(years), max(years)+2, 1), color = "black", ec="black")
    plt.xlabel('Year', fontsize=10)
    plt.ylabel('Number of publications',fontsize=10);
    plt.xticks(np.arange(1955, max(years) + 10, 10))
    plt.yticks(np.arange(5, 25 + 1, 5))
    plt.xticks(fontsize=10)
    plt.yticks(fontsize=10)

    ax = plt.gca()
    ax.tick_params(direction='in')
    ax.yaxis.set_ticks_position('both')
    ax.xaxis.set_tick_params(width=2)
    ax.yaxis.set_tick_params(width=2)
    ax.tick_params(length=6)


    for axis in ['top','bottom','left','right']:
        ax.spines[axis].set_linewidth(2)
    #ax.xaxis.set_ticks_position('both')

    plt.annotate("London"  , xy=(1962.5, 1), xytext=(1962.5, 5.5), va="center", ha="center", arrowprops=dict(arrowstyle='->, head_width=0.2', facecolor='blue'), fontsize=10,color='blue',bbox=dict(boxstyle='round,pad=0.2', fc='none', ec='none', alpha=0.3))
    plt.annotate("Repic et al."  , xy=(1968.5, 1), xytext=(1968.5, 9.5), va="center", ha="center", arrowprops=dict(arrowstyle='->, head_width=0.2', facecolor='blue'), fontsize=10,color='blue',bbox=dict(boxstyle='round,pad=0.2', fc='none',ec='none' , alpha=0.3))
    plt.annotate("Cruz"  , xy=(1979, 1), xytext=(1979,9.4), va="center", ha="center", arrowprops=dict(arrowstyle='->, head_width=0.2', facecolor='blue'), fontsize=10,color='blue',bbox=dict(boxstyle='round,pad=0.2', fc='none', ec='none', alpha=0.3))
    plt.annotate("Mars SR"   , xy=(1981.5, 7), xytext=(1981.5, 13.5), va="center", ha="center", arrowprops=dict(arrowstyle='->, head_width=0.2', facecolor='blue'), fontsize=10,color='blue',bbox=dict(boxstyle='round,pad=0.2', fc='none', ec='none', alpha=0.3))
    plt.annotate("AFE"   , xy=(1989.5, 7), xytext=(1989.5, 15.5), va="center", ha="center", arrowprops=dict(arrowstyle='->, head_width=0.2', facecolor='blue'), fontsize=10,color='blue',bbox=dict(boxstyle='round,pad=0.2', fc='none', ec='none', alpha=0.3))
    plt.annotate("Mars \n2001"   , xy=(1998.5, 6), xytext=(1998.5, 13.5), va="center", ha="center", arrowprops=dict(arrowstyle='->, head_width=0.2', facecolor='blue'), fontsize=10,color='blue',bbox=dict(boxstyle='round,pad=0.2', fc='none', ec='none', alpha=0.3))
    plt.annotate("ISPT \nstudies"  , xy=(2003, 20), xytext=(1996, 20), va="center", ha="center", arrowprops=dict(arrowstyle='->, head_width=0.2', facecolor='blue'), fontsize=10,color='blue',bbox=dict(boxstyle='round,pad=0.2', fc='none', ec='none', alpha=0.3))
    plt.annotate("Neptune \nstudies\n\n Venus \nSmallSats"  , xy=(2018.5, 10), xytext=(2018.5, 18), va="center", ha="center", arrowprops=dict(arrowstyle='->, head_width=0.2', facecolor='blue'), fontsize=10,color='blue',bbox=dict(boxstyle='round,pad=0.2', fc='none', ec='none', alpha=0.3))

    plt.xlim([1957, 2025])
    #plt.annotate("PSD assessment \n\nIce Giants\n study \n\nVenus SmallSat \nstudy"  , xy=(2017, 10), xytext=(2017, 18), va="center", ha="center", arrowprops=dict(arrowstyle='->, head_width=0.2', facecolor='blue'), fontsize=10,color='blue',bbox=dict(boxstyle='round,pad=0.2', fc='none', ec='none', alpha=0.3))
    '''
    plt.annotate("In-Space Propulsion (ISP) \n funded sudies"  , xy=(2003, 20), xytext=(1992, 20), va="center", ha="center", arrowprops=dict(width=1.0, facecolor='blue', edgecolor='blue', shrink=0.05), fontsize=10,color='blue',bbox=dict(boxstyle='round,pad=0.2', fc='yellow', alpha=0.3))
    plt.annotate("PSD Aerocapture \nAssessment \n\nIce Giants\n Aerocapture Study \n\nVenus SmallSat \nAerocapture Study"  , xy=(2017, 10), xytext=(2017, 18), va="center", ha="center", arrowprops=dict(width=1.0, facecolor='blue', edgecolor='blue', shrink=0.05), fontsize=10,color='blue',bbox=dict(boxstyle='round,pad=0.2', fc='yellow', alpha=0.3))
    '''

    plt.savefig('../plots/publication-no-hist-new.png',bbox_inches='tight')
    plt.savefig('../plots/publication-no-hist-new.pdf', dpi=300,bbox_inches='tight')
    plt.savefig('../plots/publication-no-hist-new.eps', dpi=300,bbox_inches='tight')

    plt.show()
[4]:
create_histogramYears()
[5]:
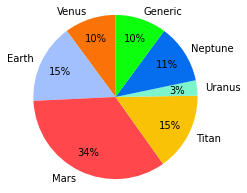
def create_pieTargetPlanet():

    v_c = sum('Venus' in s for s in planet)
    e_c = sum('Earth' in s for s in planet)
    m_c = sum('Mars' in s for s in planet)
    t_c = sum('Titan' in s for s in planet)
    u_c = sum('Uranus' in s for s in planet)
    n_c = sum('Neptune' in s for s in planet)
    g_c = sum('Generic' in s for s in planet)

    sizes  = [v_c, e_c, m_c, t_c, u_c, n_c, g_c]
    labels = ['Venus', 'Earth', 'Mars', 'Titan', 'Uranus', 'Neptune', 'Generic']

    fig=plt.figure(figsize=(3.25,3.25))

    rcParams['font.family'] = 'sans-serif'
    rcParams['font.sans-serif'] = ['DejaVu Sans']
    params = {'mathtext.default': 'regular' }
    plt.rcParams.update(params)

    colors = ['xkcd:orange', 'xkcd:pastel blue', 'xkcd:light red', 'xkcd:goldenrod', 'xkcd:light turquoise', 'xkcd:cerulean blue', 'xkcd:neon green']

    patches, texts, autotexts = plt.pie(sizes, labels=labels, colors = colors, autopct='%d%%', pctdistance = 0.75, shadow=False, startangle=90, textprops={'fontsize': 10})
    plt.axis('equal')  # Equal aspect ratio ensures that pie is drawn as a circle.
    plt.setp(autotexts, fontsize=10)
    plt.setp(texts, fontsize=10)

    plt.savefig('../plots/pie-planets.png',bbox_inches='tight')
    plt.savefig('../plots/pie-planets.pdf', dpi=500,bbox_inches='tight')
    plt.savefig('../plots/pie-planets.eps', dpi=500,bbox_inches='tight')
    plt.show()
[6]:
create_pieTargetPlanet()
C:\Users\ATHULG~1\AppData\Local\Temp/ipykernel_82784/4008509295.py:3: DeprecationWarning: Calling np.sum(generator) is deprecated, and in the future will give a different result. Use np.sum(np.fromiter(generator)) or the python sum builtin instead.
  v_c = sum('Venus' in s for s in planet)
C:\Users\ATHULG~1\AppData\Local\Temp/ipykernel_82784/4008509295.py:4: DeprecationWarning: Calling np.sum(generator) is deprecated, and in the future will give a different result. Use np.sum(np.fromiter(generator)) or the python sum builtin instead.
  e_c = sum('Earth' in s for s in planet)
C:\Users\ATHULG~1\AppData\Local\Temp/ipykernel_82784/4008509295.py:5: DeprecationWarning: Calling np.sum(generator) is deprecated, and in the future will give a different result. Use np.sum(np.fromiter(generator)) or the python sum builtin instead.
  m_c = sum('Mars' in s for s in planet)
C:\Users\ATHULG~1\AppData\Local\Temp/ipykernel_82784/4008509295.py:6: DeprecationWarning: Calling np.sum(generator) is deprecated, and in the future will give a different result. Use np.sum(np.fromiter(generator)) or the python sum builtin instead.
  t_c = sum('Titan' in s for s in planet)
C:\Users\ATHULG~1\AppData\Local\Temp/ipykernel_82784/4008509295.py:7: DeprecationWarning: Calling np.sum(generator) is deprecated, and in the future will give a different result. Use np.sum(np.fromiter(generator)) or the python sum builtin instead.
  u_c = sum('Uranus' in s for s in planet)
C:\Users\ATHULG~1\AppData\Local\Temp/ipykernel_82784/4008509295.py:8: DeprecationWarning: Calling np.sum(generator) is deprecated, and in the future will give a different result. Use np.sum(np.fromiter(generator)) or the python sum builtin instead.
  n_c = sum('Neptune' in s for s in planet)
C:\Users\ATHULG~1\AppData\Local\Temp/ipykernel_82784/4008509295.py:9: DeprecationWarning: Calling np.sum(generator) is deprecated, and in the future will give a different result. Use np.sum(np.fromiter(generator)) or the python sum builtin instead.
  g_c = sum('Generic' in s for s in planet)
[7]:
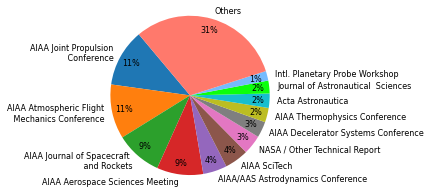
def create_pieSource():
    counter = Counter(source)

    sizes  = counter.values()
    labels = counter.keys()

    tot = len(years)

    JPC = counter['AIAA/ASME/SAE/ASEE Joint Propulsion Conference']
    AFM = counter['Atmospheric Flight Mechanics Conference']
    JSR = counter['Journal of Spacecraft and Rockets']
    ASM = counter['Aerospace Sciences Meeting']
    AAS = counter['AIAA/AAS Astrodynamics Conference']
    NTM = counter['Technical Report'] + 6
    DTC = counter['AIAA Aerodynamic Decelerator Systems Technology Conference']
    TPC = counter['Thermophysics Conference']
    AAJ = counter['Acta Astronautica']
    JAS = counter['Journal of Astronautical Sciences']
    SCI = counter['AIAA SciTech']
    IPW = counter['International Planetary Probe Workshop']


    MIS = len(source) - JSR - AFM - JPC - AAS - ASM - NTM - DTC - TPC - AAJ - JAS - SCI - IPW

    sizes  = [JPC, AFM, JSR , ASM, AAS, SCI, NTM, DTC,  TPC, AAJ, JAS,  IPW,  MIS]
    labels = ['AIAA Joint Propulsion\n Conference',
              'AIAA Atmospheric Flight\n Mechanics Conference',
              'AIAA Journal of Spacecraft \n and Rockets',
              'AIAA Aerospace Sciences Meeting',
              'AIAA/AAS Astrodynamics Conference',
              'AIAA SciTech',
              'NASA / Other Technical Report',
              'AIAA Decelerator Systems Conference',
              'AIAA Thermophysics Conference',
              'Acta Astronautica',
              'Journal of Astronautical  Sciences',
              'Intl. Planetary Probe Workshop',
              'Others']

    fig=plt.figure(figsize=(6.25, 3.25))

    rcParams['font.family'] = 'sans-serif'
    rcParams['font.sans-serif'] = ['DejaVu Sans']
    params = {'mathtext.default': 'regular' }
    plt.rcParams.update(params)


    colors = ["#1f77b4", "#ff7f0e", "#2ca02c", "#d62728", "#9467bd", "#8c564b", "#e377c2", "#7f7f7f", "#bcbd22", "#17becf", 'xkcd:neon green', 'xkcd:sky blue', 'xkcd:salmon']

    patches, texts, autotexts = plt.pie(sizes, labels=labels, colors = colors, labeldistance = 1.1 , pctdistance = 0.85, autopct='%d%%',shadow=False, startangle=130, textprops={'fontsize': 8})
    plt.axis('equal')  # Equal aspect ratio ensures that pie is drawn as a circle.
    plt.setp(autotexts, fontsize=8)
    plt.setp(texts, fontsize=8)

    plt.savefig('../plots/pie-sources.png',bbox_inches='tight')
    plt.savefig('../plots/pie-sources.pdf', dpi=500,bbox_inches='tight')
    plt.savefig('../plots/pie-sources.eps', dpi=500,bbox_inches='tight')
    plt.show()
[8]:
create_pieSource()
[9]:
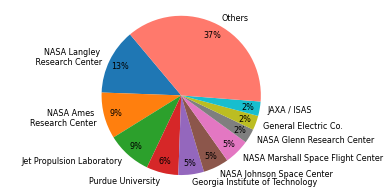
def create_pieInstitution():
    counter = Counter(author)

    sizes  = counter.values()
    labels = counter.keys()

    tot = len(years)

    LANG = counter['NASA Langley Research Center']
    AMES = counter['NASA Ames Research Center']
    JPL  = counter['Jet Propulsion Lab']
    PURD = counter['Purdue University']
    GEOR = counter['Georgia Institute of Technology']
    JOHN = counter['NASA Johnson Space Center']
    MARS = counter['NASA Marshall Space Flight Center']
    GLEN = counter['NASA Glenn Research Center']
    GECO = counter['General Electric Co.']
    JAXA = counter['Japanese Aerospace and Exploration Agency (JAXA)'] + 4


    MIS = len(source) - LANG - AMES - JPL - PURD - GEOR - JOHN -  MARS - GLEN - GECO - JAXA

    sizes  = [LANG, AMES, JPL, PURD, GEOR, JOHN, MARS, GLEN, GECO, JAXA, MIS ]
    labels = ['NASA Langley \n Research Center',
              'NASA Ames \nResearch Center',
              'Jet Propulsion Laboratory',
              'Purdue University',
              'Georgia Institute of Technology',
              'NASA Johnson Space Center',
              'NASA Marshall Space Flight Center',
              'NASA Glenn Research Center',
              'General Electric Co.',
              'JAXA / ISAS',
              'Others']

    fig=plt.figure(figsize=(6.25, 3.25))

    rcParams['font.family'] = 'sans-serif'
    rcParams['font.sans-serif'] = ['DejaVu Sans']
    params = {'mathtext.default': 'regular' }
    plt.rcParams.update(params)


    colors = ["#1f77b4", "#ff7f0e", "#2ca02c", "#d62728", "#9467bd", "#8c564b", "#e377c2", "#7f7f7f", "#bcbd22", "#17becf", 'xkcd:salmon']

    patches, texts, autotexts = plt.pie(sizes, labels=labels, colors = colors, labeldistance = 1.1 , pctdistance = 0.85, autopct='%d%%',shadow=False, startangle=130, textprops={'fontsize': 8})
    plt.axis('equal')  # Equal aspect ratio ensures that pie is drawn as a circle.
    plt.setp(autotexts, fontsize=8)
    plt.setp(texts, fontsize=8)

    plt.savefig('../plots/pie-affiliation.png',bbox_inches='tight')
    plt.savefig('../plots/pie-affiliation.pdf', dpi=500,bbox_inches='tight')
    plt.savefig('../plots/pie-affiliation.eps', dpi=500,bbox_inches='tight')
    plt.show()
[10]:
create_pieInstitution()
[11]:
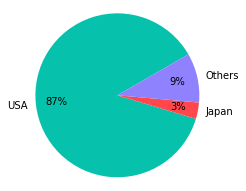
def create_pieCountry():
    counter = Counter(origin)

    sizes  = counter.values()
    labels = counter.keys()

    tot = len(years)

    US = counter['USA']
    JP = counter['Japan']


    MIS = len(source) - US - JP

    sizes  = [US, JP,  MIS ]
    labels = ['USA',
              'Japan',
              'Others']

    fig=plt.figure(figsize=(3.25, 3.25))

    rcParams['font.family'] = 'sans-serif'
    rcParams['font.sans-serif'] = ['DejaVu Sans']
    params = {'mathtext.default': 'regular' }
    plt.rcParams.update(params)


    colors = ['xkcd:turquoise', 'xkcd:light red', 'xkcd:periwinkle']

    patches, texts, autotexts = plt.pie(sizes, labels=labels, colors = colors, labeldistance = 1.1 , pctdistance = 0.75, autopct='%d%%',shadow=False, startangle=30, textprops={'fontsize': 10})
    plt.axis('equal')  # Equal aspect ratio ensures that pie is drawn as a circle.
    plt.setp(autotexts, fontsize=10)
    plt.setp(texts, fontsize=10)

    plt.savefig('../plots/pie-country.png',bbox_inches='tight')
    plt.savefig('../plots/pie-country.pdf', dpi=500,bbox_inches='tight')
    plt.savefig('../plots/pie-country.eps', dpi=500,bbox_inches='tight')
    plt.show()
[12]:
create_pieCountry()
[13]:
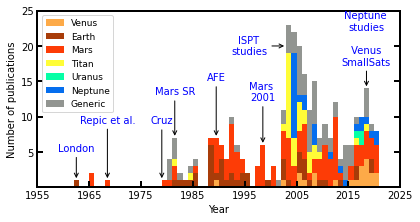
def create_histogramYearsStackedByPlanetGroup():

    years  = DATA['Year'].values

    years_ve = years
    years_ea = years
    years_ma = years
    years_ti = years
    years_ur = years
    years_ne = years
    years_ge = years
    years_ju = years
    years_sa = years

    ve_index_to_remove=np.array([0])
    ea_index_to_remove=np.array([0])
    ma_index_to_remove=np.array([0])
    ti_index_to_remove=np.array([0])
    ur_index_to_remove=np.array([0])
    ne_index_to_remove=np.array([0])
    ge_index_to_remove=np.array([0])
    ju_index_to_remove=np.array([0])
    sa_index_to_remove=np.array([0])


    for i in range(0,len(years)):
        if tclass[i] != 'Venus':
            ve_index_to_remove=np.append(ve_index_to_remove,i)

    for i in range(0,len(years)):
        if tclass[i] != 'Earth':
            ea_index_to_remove=np.append(ea_index_to_remove,i)

    for i in range(0,len(years)):
        if tclass[i] != 'Mars':
            ma_index_to_remove=np.append(ma_index_to_remove,i)

    for i in range(0,len(years)):
        if tclass[i] != 'Titan':
            ti_index_to_remove=np.append(ti_index_to_remove,i)

    for i in range(0,len(years)):
        if tclass[i] != 'Uranus':
            ur_index_to_remove=np.append(ur_index_to_remove,i)

    for i in range(0,len(years)):
        if tclass[i] != 'Neptune':
            ne_index_to_remove=np.append(ne_index_to_remove,i)

    for i in range(0,len(years)):
        if tclass[i] != 'Generic':
            ge_index_to_remove=np.append(ge_index_to_remove,i)

    '''
    for i in range(0,len(years)):
        if tclass[i] != 'Jupiter':
            ju_index_to_remove=np.append(ju_index_to_remove,i)


    for i in range(0,len(years)):
        if tclass[i] != 'Saturn':
            sa_index_to_remove=np.append(sa_index_to_remove,i)

    '''

    ve_index_to_remove=np.delete(ve_index_to_remove,0)
    ea_index_to_remove=np.delete(ea_index_to_remove,0)
    ma_index_to_remove=np.delete(ma_index_to_remove,0)
    ti_index_to_remove=np.delete(ti_index_to_remove,0)
    ur_index_to_remove=np.delete(ur_index_to_remove,0)
    ne_index_to_remove=np.delete(ne_index_to_remove,0)
    ge_index_to_remove=np.delete(ge_index_to_remove,0)
    #ju_index_to_remove=np.delete(ju_index_to_remove,0)
    #sa_index_to_remove=np.delete(sa_index_to_remove,0)

    years_ve = np.delete(years_ve, ve_index_to_remove)
    years_ea = np.delete(years_ea, ea_index_to_remove)
    years_ma = np.delete(years_ma, ma_index_to_remove)
    years_ti = np.delete(years_ti, ti_index_to_remove)
    years_ur = np.delete(years_ur, ur_index_to_remove)
    years_ne = np.delete(years_ne, ne_index_to_remove)
    years_ge = np.delete(years_ge, ge_index_to_remove)
    #years_ju = np.delete(years_ju, ju_index_to_remove)
    #years_sa = np.delete(years_sa, sa_index_to_remove)


    #years_st    = [years_ve, years_ea, years_ma, years_ju, years_sa, years_ti, years_ur, years_ne, years_ge]
    years_st    = [years_ve, years_ea, years_ma, years_ti, years_ur, years_ne, years_ge]

    fig=plt.figure(figsize=(6.5,3.25))

    rcParams['font.family'] = 'sans-serif'
    rcParams['font.sans-serif'] = ['DejaVu Sans']
    params = {'mathtext.default': 'regular' }
    plt.rcParams.update(params)
    plt.style.use('dark_background')
    plt.rcParams.update(plt.rcParamsDefault)

    colors = ['xkcd:light orange', 'xkcd:rust', 'xkcd:red orange', 'xkcd:sunshine yellow', 'xkcd:bright sea green', 'xkcd:cerulean blue', 'xkcd:grey']

    plt.hist(years_st, bins=np.arange(min(years), max(years)+2, 1), stacked=True, label=['Venus', 'Earth', 'Mars','Titan', 'Uranus', 'Neptune', 'Generic'],color=colors)
    plt.xlabel('Year', fontsize=10)
    plt.ylabel('Number of publications',fontsize=10);
    plt.xticks(np.arange(1955, max(years) + 10, 10))
    plt.yticks(np.arange(5, 25 + 1, 5))
    plt.xticks(fontsize=10)
    plt.yticks(fontsize=10)

    ax = plt.gca()
    ax.tick_params(direction='in')
    ax.yaxis.set_ticks_position('both')

    plt.annotate("London"  , xy=(1962.5, 1), xytext=(1962.5, 5.5), va="center", ha="center", arrowprops=dict(arrowstyle='->, head_width=0.2', facecolor='blue'), fontsize=10,color='blue',bbox=dict(boxstyle='round,pad=0.2', fc='none', ec='none', alpha=0.3))
    plt.annotate("Repic et al."  , xy=(1968.5, 1), xytext=(1968.5, 9.5), va="center", ha="center", arrowprops=dict(arrowstyle='->, head_width=0.2', facecolor='blue'), fontsize=10,color='blue',bbox=dict(boxstyle='round,pad=0.2', fc='none',ec='none' , alpha=0.3))
    plt.annotate("Cruz"  , xy=(1979, 1), xytext=(1979,9.4), va="center", ha="center", arrowprops=dict(arrowstyle='->, head_width=0.2', facecolor='blue'), fontsize=10,color='blue',bbox=dict(boxstyle='round,pad=0.2', fc='none', ec='none', alpha=0.3))
    plt.annotate("Mars SR"   , xy=(1981.5, 7), xytext=(1981.5, 13.5), va="center", ha="center", arrowprops=dict(arrowstyle='->, head_width=0.2', facecolor='blue'), fontsize=10,color='blue',bbox=dict(boxstyle='round,pad=0.2', fc='none', ec='none', alpha=0.3))
    plt.annotate("AFE"   , xy=(1989.5, 7), xytext=(1989.5, 15.5), va="center", ha="center", arrowprops=dict(arrowstyle='->, head_width=0.2', facecolor='blue'), fontsize=10,color='blue',bbox=dict(boxstyle='round,pad=0.2', fc='none', ec='none', alpha=0.3))
    plt.annotate("Mars \n2001"   , xy=(1998.5, 6), xytext=(1998.5, 13.5), va="center", ha="center", arrowprops=dict(arrowstyle='->, head_width=0.2', facecolor='blue'), fontsize=10,color='blue',bbox=dict(boxstyle='round,pad=0.2', fc='none', ec='none', alpha=0.3))
    plt.annotate("ISPT \nstudies"  , xy=(2003, 20), xytext=(1996, 20), va="center", ha="center", arrowprops=dict(arrowstyle='->, head_width=0.2', facecolor='blue'), fontsize=10,color='blue',bbox=dict(boxstyle='round,pad=0.2', fc='none', ec='none', alpha=0.3))
    plt.annotate("Neptune \nstudies\n\n Venus \nSmallSats"  , xy=(2018.5, 14), xytext=(2018.5, 21), va="center", ha="center", arrowprops=dict(arrowstyle='->, head_width=0.2', facecolor='blue'), fontsize=10,color='blue',bbox=dict(boxstyle='round,pad=0.2', fc='none', ec='none', alpha=0.3))


    #plt.xlim([1958,2027])

    #plt.annotate("Neptune aerocapture studies \n (Lockwood et al., 2006)"  , xy=(2004.5, 15.0), xytext=(1988, 15.0), va="center", ha="center", arrowprops=dict(width=0.3, facecolor='black', edgecolor='black', shrink=0.05, headwidth=4.0), fontsize=9,color='black',bbox=dict(boxstyle='round,pad=0.2', fc='none',ec='none', alpha=0.3))
    #plt.annotate("PSD assessment  \n (Spilker et al., 2016) \n \n Aerocapture \n assessment \n (Saikia et al., 2016)"  , xy=(2017.5, 8.6),  xytext=(2017.5, 18.0), va="center", ha="center", arrowprops=dict(width=0.3, facecolor='black', edgecolor='black', shrink=0.05, headwidth=4.0), fontsize=9,color='black',bbox=dict(boxstyle='round,pad=0.2', fc='none',ec='none', alpha=0.3))

    ax = plt.gca()
    ax.tick_params(direction='in')
    plt.legend(loc='upper left', fontsize=9)

    ax.xaxis.set_tick_params(width=2)
    ax.yaxis.set_tick_params(width=2)
    ax.tick_params(length=6)


    for axis in ['top','bottom','left','right']:
        ax.spines[axis].set_linewidth(2)

    plt.savefig('../plots/hist-byPlanet-new.png',bbox_inches='tight')
    plt.savefig('../plots/hist-byPlanet-new.pdf', dpi=500,bbox_inches='tight')
    plt.savefig('../plots/hist-byPlanet-new.eps', dpi=500,bbox_inches='tight')

    plt.show()
[14]:
create_histogramYearsStackedByPlanetGroup()
The PostScript backend does not support transparency; partially transparent artists will be rendered opaque.
The PostScript backend does not support transparency; partially transparent artists will be rendered opaque.
[15]:
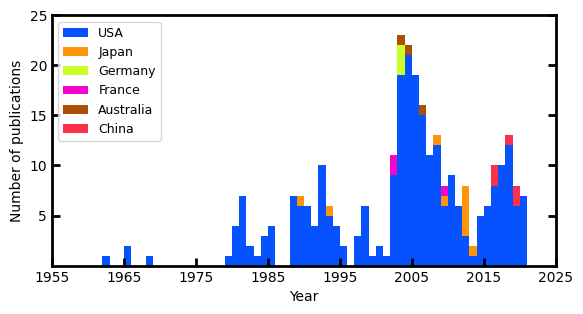
def create_histogramYearsStackedByCountry():

    years  = DATA['Year'].values

    years_us = years
    years_jp = years
    years_ru = years
    years_de = years
    years_fr = years
    years_au = years
    years_ca = years
    years_in = years
    years_it = years
    years_nl = years
    years_sk = years
    years_sp = years
    years_sv = years
    years_cn = years

    us_index_to_remove=np.array([0])
    jp_index_to_remove=np.array([0])
    ru_index_to_remove=np.array([0])
    de_index_to_remove=np.array([0])
    fr_index_to_remove=np.array([0])
    au_index_to_remove=np.array([0])
    ca_index_to_remove=np.array([0])
    in_index_to_remove=np.array([0])
    it_index_to_remove=np.array([0])
    nl_index_to_remove=np.array([0])
    sk_index_to_remove=np.array([0])
    sp_index_to_remove=np.array([0])
    sv_index_to_remove=np.array([0])
    cn_index_to_remove=np.array([0])

    for i in range(0,len(years)):
        if origin[i] != 'USA':
            us_index_to_remove=np.append(us_index_to_remove,i)

    for i in range(0,len(years)):
        if origin[i] != 'Japan':
            jp_index_to_remove=np.append(jp_index_to_remove,i)

    for i in range(0,len(years)):
        if origin[i] != 'Russia':
            ru_index_to_remove=np.append(ru_index_to_remove,i)

    for i in range(0,len(years)):
        if origin[i] != 'Germany':
            de_index_to_remove=np.append(de_index_to_remove,i)

    for i in range(0,len(years)):
        if origin[i] != 'France':
            fr_index_to_remove=np.append(fr_index_to_remove,i)

    for i in range(0,len(years)):
        if origin[i] != 'Australia':
            au_index_to_remove=np.append(au_index_to_remove,i)

    for i in range(0,len(years)):
        if origin[i] != 'Canada':
            ca_index_to_remove=np.append(ca_index_to_remove,i)

    for i in range(0,len(years)):
        if origin[i] != 'India':
            in_index_to_remove=np.append(in_index_to_remove,i)

    for i in range(0,len(years)):
        if origin[i] != 'Italy':
            it_index_to_remove=np.append(it_index_to_remove,i)

    for i in range(0,len(years)):
        if origin[i] != 'Netherlands':
            nl_index_to_remove=np.append(nl_index_to_remove,i)

    for i in range(0,len(years)):
        if origin[i] != 'S. Korea':
            sk_index_to_remove=np.append(sk_index_to_remove,i)

    for i in range(0,len(years)):
        if origin[i] != 'Spain':
            sp_index_to_remove=np.append(sp_index_to_remove,i)

    for i in range(0,len(years)):
        if origin[i] != 'Sweden':
            sv_index_to_remove=np.append(sv_index_to_remove,i)

    for i in range(0,len(years)):
        if origin[i] != 'China':
            cn_index_to_remove=np.append(cn_index_to_remove,i)


    us_index_to_remove=np.delete(us_index_to_remove,0)
    jp_index_to_remove=np.delete(jp_index_to_remove,0)
    ru_index_to_remove=np.delete(ru_index_to_remove,0)
    de_index_to_remove=np.delete(de_index_to_remove,0)
    fr_index_to_remove=np.delete(fr_index_to_remove,0)
    au_index_to_remove=np.delete(au_index_to_remove,0)
    ca_index_to_remove=np.delete(ca_index_to_remove,0)
    in_index_to_remove=np.delete(in_index_to_remove,0)
    it_index_to_remove=np.delete(it_index_to_remove,0)
    nl_index_to_remove=np.delete(nl_index_to_remove,0)
    sk_index_to_remove=np.delete(sk_index_to_remove,0)
    sp_index_to_remove=np.delete(sp_index_to_remove,0)
    sv_index_to_remove=np.delete(sv_index_to_remove,0)
    cn_index_to_remove=np.delete(cn_index_to_remove,0)

    years_us = np.delete(years_us, us_index_to_remove)
    years_jp = np.delete(years_jp, jp_index_to_remove)
    years_ru = np.delete(years_ru, ru_index_to_remove)
    years_de = np.delete(years_de, de_index_to_remove)
    years_fr = np.delete(years_fr, fr_index_to_remove)
    years_au = np.delete(years_au, au_index_to_remove)
    years_ca = np.delete(years_ca, ca_index_to_remove)
    years_in = np.delete(years_in, in_index_to_remove)
    years_it = np.delete(years_it, it_index_to_remove)
    years_nl = np.delete(years_nl, nl_index_to_remove)
    years_sk = np.delete(years_sk, sk_index_to_remove)
    years_sp = np.delete(years_sp, sp_index_to_remove)
    years_sv = np.delete(years_sv, sv_index_to_remove)
    years_cn = np.delete(years_cn, cn_index_to_remove)

    years_st    = [years_us, years_jp,  years_de, years_fr, years_au, years_cn]

    fig=plt.figure(figsize=(6.5,3.25))

    rcParams['font.family'] = 'sans-serif'
    rcParams['font.sans-serif'] = ['DejaVu Sans']
    params = {'mathtext.default': 'regular' }
    plt.rcParams.update(params)
    plt.style.use('dark_background')
    plt.rcParams.update(plt.rcParamsDefault)
    colors = ['xkcd:electric blue', 'xkcd:tangerine', 'xkcd:green yellow', 'xkcd:hot magenta', 'xkcd:cinnamon',  'xkcd:lightish red']


    plt.hist(years_st, bins=np.arange(min(years), max(years)+2, 1), stacked=True, label=['USA', 'Japan', 'Germany', 'France', 'Australia',  'China'],color=colors)
    plt.xlabel('Year', fontsize=10)
    plt.ylabel('Number of publications',fontsize=10);
    plt.xticks(np.arange(1955, max(years) + 10, 10))
    plt.yticks(np.arange(5, 25 + 1, 5))
    plt.xticks(fontsize=10)
    plt.yticks(fontsize=10)

    ax = plt.gca()
    ax.tick_params(direction='in')
    ax.yaxis.set_ticks_position('both')

    ax.xaxis.set_tick_params(width=2)
    ax.yaxis.set_tick_params(width=2)
    ax.tick_params(length=6)


    for axis in ['top','bottom','left','right']:
        ax.spines[axis].set_linewidth(2)

    plt.legend(loc='upper left', fontsize=9)


    plt.savefig('../plots/hist-byCountry-new.png',bbox_inches='tight')
    plt.savefig('../plots/hist-byCountry-new.pdf', dpi=500,bbox_inches='tight')
    plt.savefig('../plots/hist-byCountry-new.eps', dpi=500,bbox_inches='tight')


    plt.show()
[16]:
create_histogramYearsStackedByCountry()
The PostScript backend does not support transparency; partially transparent artists will be rendered opaque.
The PostScript backend does not support transparency; partially transparent artists will be rendered opaque.
[ ]: