Example - 07 - Venus Aerocapture: Part 3
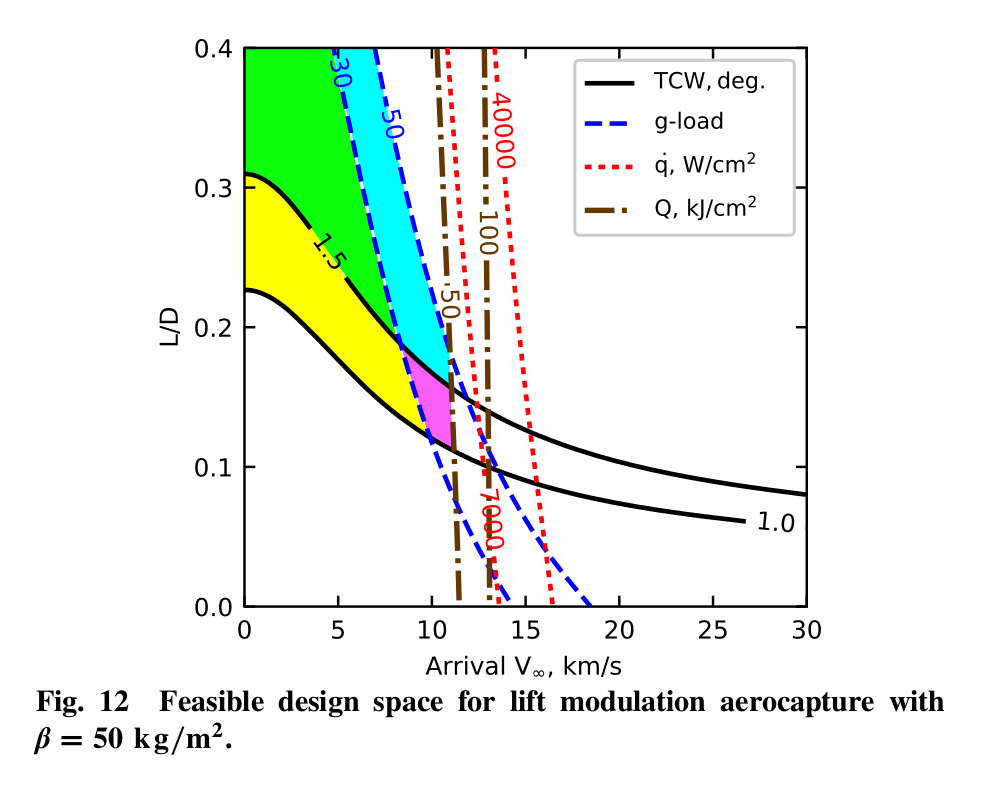
In this example, you will learn to create an aerocapture feasibility chart for Venus.
For reference, we will re-create a figure from the paper “Girija, Lu, and Saikia, Feasibility and Mass-Benefit Analysis of Aerocapture for Missions to Venus, Journal of Spacecraft and Rockets, Vol. 57, No. 1” DOI: 10.2514/1.A34529
[1]:
from IPython.display import Image
Image(filename='../plots/girijaYe2020a-reference.png', width=600)
[1]:
[3]:
from AMAT.planet import Planet
from AMAT.vehicle import Vehicle

import numpy as np
from scipy import interpolate

import matplotlib.pyplot as plt
from matplotlib import rcParams
from matplotlib.patches import Polygon
import os
[4]:
# Create a planet object
planet=Planet("VENUS")
planet.h_skip = 150000.0

# Load an nominal atmospheric profile with height, temp, pressure, density data
planet.loadAtmosphereModel('../atmdata/Venus/venus-gram-avg.dat', 0 , 1 ,2, 3 )

vinf_kms_array = np.linspace( 0.0,   30.0,  11)
LD_array       = np.linspace( 0.0,    0.4 , 11)
[5]:
os.makedirs('../data/girijaYe2019a')
runID = 'BC50RAP400EI150-'

num_total      = len(vinf_kms_array)*len(LD_array)
count = 1

v0_kms_array    = np.zeros(len(vinf_kms_array))
v0_kms_array[:] = np.sqrt(1.0*(vinf_kms_array[:]*1E3)**2.0 +\
                          2*np.ones(len(vinf_kms_array))*\
                          planet.GM/(planet.RP+150.0*1.0E3))/1.0E3

overShootLimit_array  = np.zeros((len(v0_kms_array),len(LD_array)))
underShootLimit_array = np.zeros((len(v0_kms_array),len(LD_array)))
exitflag_os_array     = np.zeros((len(v0_kms_array),len(LD_array)))
exitflag_us_array     = np.zeros((len(v0_kms_array),len(LD_array)))
TCW_array             = np.zeros((len(v0_kms_array),len(LD_array)))
[6]:
# NOTE: This will take about an hour.

for i in range(0,len(v0_kms_array)):
    for j in range(0,len(LD_array)):
        vehicle=Vehicle('Apollo', 1000.0, 50.0, LD_array[j], 3.1416, 0.0, 1.00, planet)
        vehicle.setInitialState(150.0,0.0,0.0,v0_kms_array[i],0.0,-4.5,0.0,0.0)
        vehicle.setSolverParams(1E-6)
        overShootLimit_array[i,j],  exitflag_os_array[i,j]  = vehicle.findOverShootLimit (2400.0, 0.1, -80.0, -4.0, 1E-10, 400.0)
        underShootLimit_array[i,j], exitflag_us_array[i,j] =  vehicle.findUnderShootLimit(2400.0, 0.1, -80.0, -4.0, 1E-10, 400.0)

        TCW_array[i,j] = overShootLimit_array[i,j] - underShootLimit_array[i,j]

        print("Run #"+str(count)+" of "+ str(num_total)+": Arrival V_infty: "+str(vinf_kms_array[i])+" km/s"+", L/D:"+str(LD_array[j]) + " OSL: "+str(overShootLimit_array[i,j])+" USL: "+str(underShootLimit_array[i,j])+", TCW: "+str(TCW_array[i,j])+" EFOS: "+str(exitflag_os_array[i,j])+ " EFUS: "+str(exitflag_us_array[i,j]))
        count = count +1

np.savetxt('../data/girijaYe2019a/'+runID+'vinf_kms_array.txt',vinf_kms_array)
np.savetxt('../data/girijaYe2019a/'+runID+'v0_kms_array.txt',v0_kms_array)
np.savetxt('../data/girijaYe2019a/'+runID+'LD_array.txt',LD_array)
np.savetxt('../data/girijaYe2019a/'+runID+'overShootLimit_array.txt',overShootLimit_array)
np.savetxt('../data/girijaYe2019a/'+runID+'exitflag_os_array.txt',exitflag_os_array)
np.savetxt('../data/girijaYe2019a/'+runID+'undershootLimit_array.txt',underShootLimit_array)
np.savetxt('../data/girijaYe2019a/'+runID+'exitflag_us_array.txt',exitflag_us_array)
np.savetxt('../data/girijaYe2019a/'+runID+'TCW_array.txt',TCW_array)
Run #1 of 4: Arrival V_infty: 0.0 km/s, L/D:0.0 OSL: -5.0166317711664306 USL: -5.0166317711664306, TCW: 0.0 EFOS: 1.0 EFUS: 1.0
Run #2 of 4: Arrival V_infty: 0.0 km/s, L/D:0.4 OSL: -4.650539502421452 USL: -6.815560043607547, TCW: 2.165020541186095 EFOS: 1.0 EFUS: 1.0
Run #3 of 4: Arrival V_infty: 30.0 km/s, L/D:0.0 OSL: -7.44011820455853 USL: -7.44011820455853, TCW: 0.0 EFOS: 1.0 EFUS: 1.0
Run #4 of 4: Arrival V_infty: 30.0 km/s, L/D:0.4 OSL: -6.604976565784455 USL: -22.98797720550283, TCW: 16.383000639718375 EFOS: 1.0 EFUS: 1.0
[7]:
acc_net_g_max_array       = np.zeros((len(v0_kms_array),len(LD_array)))
stag_pres_atm_max_array   = np.zeros((len(v0_kms_array),len(LD_array)))
q_stag_total_max_array    = np.zeros((len(v0_kms_array),len(LD_array)))
heatload_max_array        = np.zeros((len(v0_kms_array),len(LD_array)))


for i in range(0,len(v0_kms_array)):
    for j in range(0,len(LD_array)):
        vehicle=Vehicle('Apollo', 1000.0, 50.0, LD_array[j], 3.1416, 0.0, 1.00, planet)
        vehicle.setInitialState(150.0,0.0,0.0,v0_kms_array[i],0.0,overShootLimit_array[i,j],0.0,0.0)
        vehicle.setSolverParams(1E-6)
        vehicle.propogateEntry (2400.0, 0.1, 180.0)

        # Extract and save variables to plot
        t_min_os         = vehicle.t_minc
        h_km_os          = vehicle.h_kmc
        acc_net_g_os     = vehicle.acc_net_g
        q_stag_con_os    = vehicle.q_stag_con
        q_stag_rad_os    = vehicle.q_stag_rad
        rc_os            = vehicle.rc
        vc_os            = vehicle.vc
        stag_pres_atm_os = vehicle.computeStagPres(rc_os,vc_os)/(1.01325E5)
        heatload_os      = vehicle.heatload

        vehicle=Vehicle('Apollo', 1000.0, 50.0, LD_array[j], 3.1416, 0.0, 1.00, planet)
        vehicle.setInitialState(150.0,0.0,0.0,v0_kms_array[i],0.0,underShootLimit_array[i,j],0.0,0.0)
        vehicle.setSolverParams(1E-6)
        vehicle.propogateEntry (2400.0, 0.1, 0.0)

        # Extract and save variable to plot
        t_min_us         = vehicle.t_minc
        h_km_us          = vehicle.h_kmc
        acc_net_g_us     = vehicle.acc_net_g
        q_stag_con_us    = vehicle.q_stag_con
        q_stag_rad_us    = vehicle.q_stag_rad
        rc_us            = vehicle.rc
        vc_us            = vehicle.vc
        stag_pres_atm_us = vehicle.computeStagPres(rc_us,vc_us)/(1.01325E5)
        heatload_us      = vehicle.heatload

        q_stag_total_os  = q_stag_con_os + q_stag_rad_os
        q_stag_total_us  = q_stag_con_us + q_stag_rad_us

        acc_net_g_max_array[i,j]      = max(max(acc_net_g_os),max(acc_net_g_us))
        stag_pres_atm_max_array[i,j]   = max(max(stag_pres_atm_os),max(stag_pres_atm_os))
        q_stag_total_max_array[i,j]   = max(max(q_stag_total_os),max(q_stag_total_us))
        heatload_max_array[i,j]       = max(max(heatload_os),max(heatload_us))

        print("V_infty: "+str(vinf_kms_array[i])+" km/s"+", L/D: "+str(LD_array[j])+" G_MAX: "+str(acc_net_g_max_array[i,j])+" QDOT_MAX: "+str(q_stag_total_max_array[i,j])+" J_MAX: "+str(heatload_max_array[i,j])+" STAG. PRES: "+str(stag_pres_atm_max_array[i,j]))


np.savetxt('../data/girijaYe2019a/'+runID+'acc_net_g_max_array.txt',acc_net_g_max_array)
np.savetxt('../data/girijaYe2019a/'+runID+'stag_pres_atm_max_array.txt',stag_pres_atm_max_array)
np.savetxt('../data/girijaYe2019a/'+runID+'q_stag_total_max_array.txt',q_stag_total_max_array)
np.savetxt('../data/girijaYe2019a/'+runID+'heatload_max_array.txt',heatload_max_array)
V_infty: 0.0 km/s, L/D: 0.0 G_MAX: 3.953230700877381 QDOT_MAX: 108.34036601208729 J_MAX: 10463.898911024176 STAG. PRES: 0.019145177375447076
V_infty: 0.0 km/s, L/D: 0.4 G_MAX: 15.806088566064293 QDOT_MAX: 209.94886974217718 J_MAX: 18096.44195688157 STAG. PRES: 0.006702446102743174
V_infty: 30.0 km/s, L/D: 0.0 G_MAX: 139.56205504004248 QDOT_MAX: 34169148.177942365 J_MAX: 236829784.25897062 STAG. PRES: 0.6754469940813033
V_infty: 30.0 km/s, L/D: 0.4 G_MAX: 1480.2009655208392 QDOT_MAX: 396622642.1911957 J_MAX: 353048193.59636647 STAG. PRES: 0.1343203200123287
[8]:
x = np.loadtxt('../data/girijaYe2019a/'+runID+'vinf_kms_array.txt')
y = np.loadtxt('../data/girijaYe2019a/'+runID+'LD_array.txt')

Z1 = np.loadtxt('../data/girijaYe2019a/'+runID+'TCW_array.txt')
G1 = np.loadtxt('../data/girijaYe2019a/'+runID+'acc_net_g_max_array.txt')
Q1 = np.loadtxt('../data/girijaYe2019a/'+runID+'q_stag_total_max_array.txt')
H1 = np.loadtxt('../data/girijaYe2019a/'+runID+'heatload_max_array.txt')
S1 = np.loadtxt('../data/girijaYe2019a/'+runID+'stag_pres_atm_max_array.txt')


f1 = interpolate.interp2d(x, y, np.transpose(Z1), kind='cubic')
g1 = interpolate.interp2d(x, y, np.transpose(G1), kind='cubic')
q1 = interpolate.interp2d(x, y, np.transpose(Q1), kind='cubic')
h1 = interpolate.interp2d(x, y, np.transpose(H1), kind='cubic')
s1 = interpolate.interp2d(x, y, np.transpose(S1), kind='cubic')


x_new =  np.linspace( 0.0,   30,  110)
y_new =  np.linspace( 0.0,   0.4 ,110)
z_new =  np.zeros((len(x_new),len(y_new)))

z1_new =  np.zeros((len(x_new),len(y_new)))
g1_new =  np.zeros((len(x_new),len(y_new)))
q1_new =  np.zeros((len(x_new),len(y_new)))
h1_new =  np.zeros((len(x_new),len(y_new)))
s1_new =  np.zeros((len(x_new),len(y_new)))

for i in range(0,len(x_new)):
    for j in range(0,len(y_new)):

            z1_new[i,j] = f1(x_new[i],y_new[j])
            g1_new[i,j] = g1(x_new[i],y_new[j])
            q1_new[i,j] = q1(x_new[i],y_new[j])
            h1_new[i,j] = h1(x_new[i],y_new[j])
            s1_new[i,j] = s1(x_new[i],y_new[j])


Z1 = z1_new
G1 = g1_new
Q1 = q1_new
S1 = s1_new
H1 = h1_new/1000.0

X, Y = np.meshgrid(x_new, y_new)


Zlevels = np.array([1.0,1.5])
Glevels = np.array([30.0, 50.0])
Qlevels = np.array([7000.0, 40000.0])
Hlevels = np.array([50.0, 100.0])
Slevels = np.array([0.8])


fig = plt.figure()
fig.set_size_inches([3.25,3.25])
plt.ion()
plt.rc('font',family='Times New Roman')
params = {'mathtext.default': 'regular' }
plt.rcParams.update(params)

ZCS1 = plt.contour(X, Y, np.transpose(Z1), levels=Zlevels, colors='black')
plt.clabel(ZCS1, inline=1, fontsize=10, colors='black',fmt='%.1f',inline_spacing=1)
ZCS1.collections[0].set_linewidths(1.50)
ZCS1.collections[1].set_linewidths(1.50)
ZCS1.collections[0].set_label(r'$TCW, deg.$')

GCS1 = plt.contour(X, Y, np.transpose(G1), levels=Glevels, colors='blue',linestyles='dashed')
plt.clabel(GCS1, inline=1, fontsize=10, colors='blue',fmt='%d',inline_spacing=0)
GCS1.collections[0].set_linewidths(1.50)
GCS1.collections[1].set_linewidths(1.50)
GCS1.collections[0].set_label(r'$g$'+r'-load')

QCS1 = plt.contour(X, Y, np.transpose(Q1), levels=Qlevels, colors='red',linestyles='dotted',zorder=11)
plt.clabel(QCS1, inline=1, fontsize=10, colors='red',fmt='%d',inline_spacing=0)
QCS1.collections[0].set_linewidths(1.50)
QCS1.collections[1].set_linewidths(1.50)
QCS1.collections[0].set_label(r'$\dot{q}$'+', '+r'$W/cm^2$')


HCS1 = plt.contour(X, Y, np.transpose(H1), levels=Hlevels, colors='xkcd:brown',linestyles='dashdot')
plt.clabel(HCS1, inline=1, fontsize=10, colors='xkcd:brown',fmt='%d',inline_spacing=0)
HCS1.collections[0].set_linewidths(1.75)
HCS1.collections[1].set_linewidths(1.75)
HCS1.collections[0].set_label(r'$Q$'+', '+r'$kJ/cm^2$')


#SCS1 = plt.contour(X, Y, transpose(S1), levels=Slevels, colors='cyan')
#plt.clabel(SCS1, inline=1, fontsize=10, colors='xkcd:neon green',fmt='%.1f',inline_spacing=1)
#SCS1.collections[0].set_linewidths(1.75)
#SCS1.collections[0].set_label(r'$Peak$'+r' '+r'$stag. pressure,atm$')

plt.xlabel("Arrival "+r'$V_\infty$'+r', km/s' ,fontsize=10)
plt.ylabel("L/D",fontsize=10)
plt.xticks(fontsize=10)
plt.yticks(np.array([ 0.0, 0.1, 0.2, 0.3, 0.4]),fontsize=10)
ax = plt.gca()
ax.tick_params(direction='in')
ax.yaxis.set_ticks_position('both')
ax.xaxis.set_ticks_position('both')
plt.legend(loc='upper right', fontsize=8)


dat0 = ZCS1.allsegs[1][0]
x1,y1=dat0[:,0],dat0[:,1]
F1 = interpolate.interp1d(x1, y1, kind='linear',fill_value='extrapolate', bounds_error=False)

dat1 = GCS1.allsegs[0][0]
x2,y2=dat1[:,0],dat1[:,1]
F2 = interpolate.interp1d(x2, y2, kind='linear',fill_value='extrapolate', bounds_error=False)

dat2 = HCS1.allsegs[0][0]
x3,y3= dat2[:,0],dat2[:,1]
F3 = interpolate.interp1d(x3, y3, kind='linear',fill_value='extrapolate', bounds_error=False)

dat0a = ZCS1.allsegs[0][0]
x1a,y1a=dat0a[:,0],dat0a[:,1]
F1a = interpolate.interp1d(x1a, y1a, kind='linear',fill_value='extrapolate', bounds_error=False)


x4 = np.linspace(0,30,301)
y4 = F1(x4)
y4a =F1a(x4)
y5 = F2(x4)
y6 = F3(x4)

y7 = np.minimum(y5,y6)
y8 = np.minimum(y4,y5)

plt.fill_between(x4, y4, y7, where=y4<=y7,color='xkcd:neon green')

plt.fill_between(x4, y4a, y8, where=y4a<=y8,color='xkcd:bright yellow')

plt.xlim([0.0,30.0])
plt.ylim([0.0,0.4])

plt.savefig('../plots/girijaYe2019a-fig12.png',bbox_inches='tight')
plt.savefig('../plots/girijaYe2019a-fig12.pdf', dpi=300,bbox_inches='tight')
plt.savefig('../plots/girijaYe2019a-fig12.eps', dpi=300,bbox_inches='tight')

plt.show()
The PostScript backend does not support transparency; partially transparent artists will be rendered opaque.
The PostScript backend does not support transparency; partially transparent artists will be rendered opaque.
The PostScript backend does not support transparency; partially transparent artists will be rendered opaque.
The PostScript backend does not support transparency; partially transparent artists will be rendered opaque.
[11]:
from IPython.display import Image
Image(filename='../plots/girijaYe2020a-higher-res.png', width=600)
[11]:
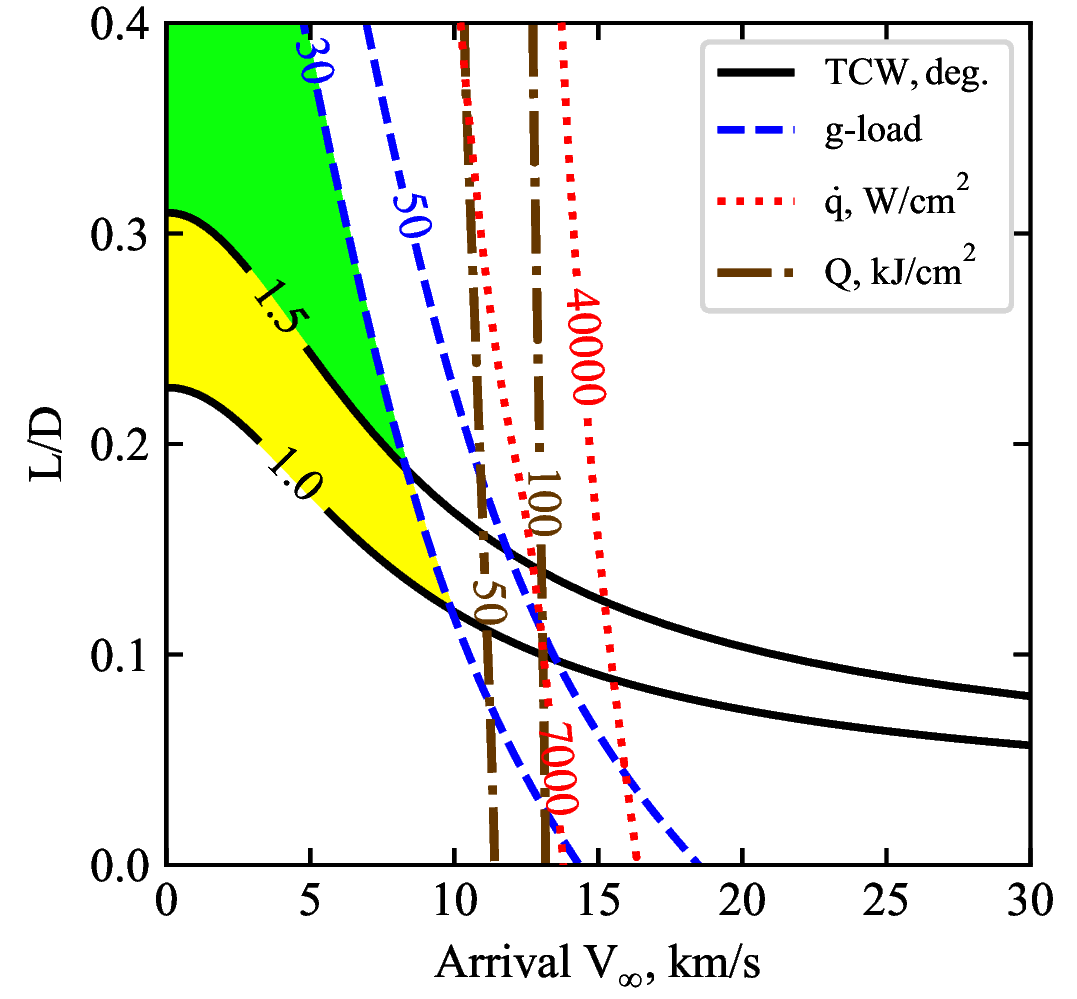
The plots are now saved in plots/girijaYe2019a and should match with the results from the paper.
Congratulations! You are now becoming an expert at creating aerocapture feasibility charts using AMAT. In the next example, we will create a similar feasibility chart for drag modulation aerocapture at Venus.