Example - 09 - Uranus Aerocapture
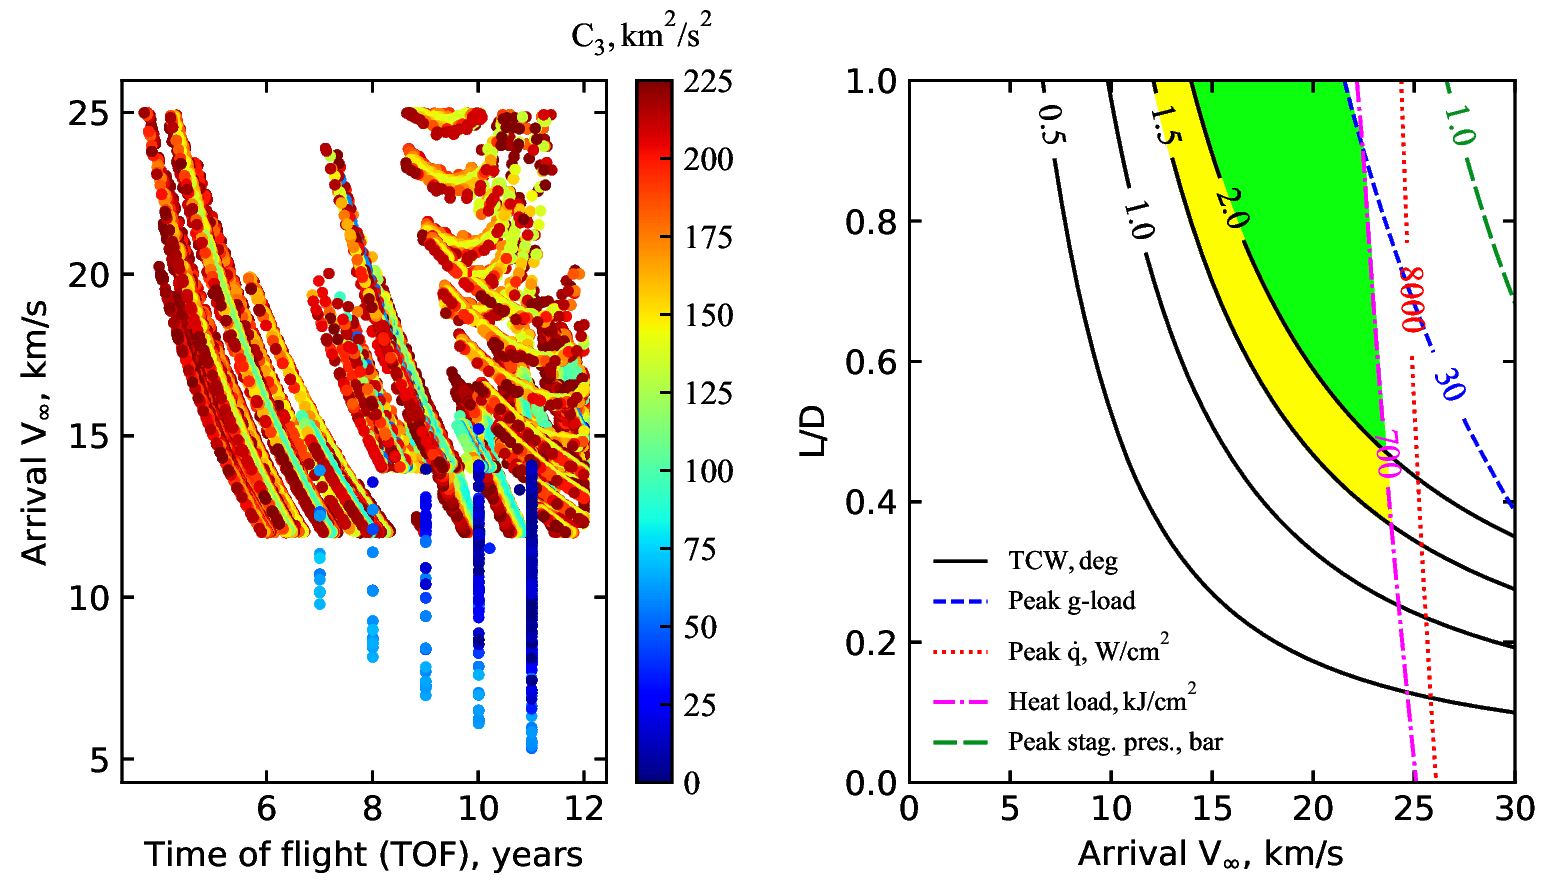
In this example, we will create combined interplanetary and aerocapture feasibility charts for Uranus.
[1]:
from AMAT.planet import Planet
from AMAT.vehicle import Vehicle

import numpy as np
from scipy import interpolate
import pandas as pd

import matplotlib.pyplot as plt
from matplotlib import rcParams
from matplotlib.patches import Polygon
import os
[3]:
# Create a planet object
planet=Planet("URANUS")

# Load an nominal atmospheric profile with height, temp, pressure, density data
planet.loadAtmosphereModel('../atmdata/Uranus/uranus-ames.dat', 0 , 1 , 2, 3)

vinf_kms_array = np.linspace( 0.0,   30.0,  11)
LD_array       = np.linspace( 0.0,    1.0 , 11)

#vinf_kms_array = np.linspace( 0.0,   30.0,  2)
#LD_array       = np.linspace( 0.0,    1.0 , 2)
[4]:
os.makedirs('../data/girijaSaikia2019a')
runID = '20DAYBC200FINEGRID1'


num_total      = len(vinf_kms_array)*len(LD_array)
count = 1

v0_kms_array    = np.zeros(len(vinf_kms_array))
v0_kms_array[:] = np.sqrt(1.0*(vinf_kms_array[:]*1E3)**2.0 +\
                          2*np.ones(len(vinf_kms_array))*\
                          planet.GM/(planet.RP+1500.0*1.0E3))/1.0E3

overShootLimit_array  = np.zeros((len(v0_kms_array),len(LD_array)))
underShootLimit_array = np.zeros((len(v0_kms_array),len(LD_array)))
exitflag_os_array     = np.zeros((len(v0_kms_array),len(LD_array)))
exitflag_us_array     = np.zeros((len(v0_kms_array),len(LD_array)))
TCW_array             = np.zeros((len(v0_kms_array),len(LD_array)))
[5]:
for i in range(0,len(v0_kms_array)):
    for j in range(0,len(LD_array)):
        vehicle=Vehicle('Oberon', 1000.0, 200.0, LD_array[j], 3.1416, 0.0, 1.00, planet)
        vehicle.setInitialState(1500.0,0.0,0.0,v0_kms_array[i],0.0,-4.5,0.0,0.0)
        vehicle.setSolverParams(1E-6)
        overShootLimit_array[i,j],  exitflag_os_array[i,j]  = vehicle.findOverShootLimit (2400.0, 0.1, -80.0, -4.0, 1E-10, 1491329.10)
        underShootLimit_array[i,j], exitflag_us_array[i,j] =  vehicle.findUnderShootLimit(2400.0, 0.1, -80.0, -4.0, 1E-10, 1491329.10)

        TCW_array[i,j] = overShootLimit_array[i,j] - underShootLimit_array[i,j]

        print("Run #"+str(count)+" of "+ str(num_total)+": Arrival V_infty: "+str(vinf_kms_array[i])+" km/s"+", L/D:"+str(LD_array[j]) + " OSL: "+str(overShootLimit_array[i,j])+" USL: "+str(underShootLimit_array[i,j])+", TCW: "+str(TCW_array[i,j])+" EFOS: "+str(exitflag_os_array[i,j])+ " EFUS: "+str(exitflag_us_array[i,j]))
        count = count +1

np.savetxt('../data/girijaSaikia2019a/'+runID+'vinf_kms_array.txt',vinf_kms_array)
np.savetxt('../data/girijaSaikia2019a/'+runID+'v0_kms_array.txt',v0_kms_array)
np.savetxt('../data/girijaSaikia2019a/'+runID+'LD_array.txt',LD_array)
np.savetxt('../data/girijaSaikia2019a/'+runID+'overShootLimit_array.txt',overShootLimit_array)
np.savetxt('../data/girijaSaikia2019a/'+runID+'exitflag_os_array.txt',exitflag_os_array)
np.savetxt('../data/girijaSaikia2019a/'+runID+'undershootLimit_array.txt',underShootLimit_array)
np.savetxt('../data/girijaSaikia2019a/'+runID+'exitflag_us_array.txt',exitflag_us_array)
np.savetxt('../data/girijaSaikia2019a/'+runID+'TCW_array.txt',TCW_array)
Run #1 of 4: Arrival V_infty: 0.0 km/s, L/D:0.0 OSL: -8.036447100388614 USL: -8.036447100388614, TCW: 0.0 EFOS: 1.0 EFUS: 1.0
Run #2 of 4: Arrival V_infty: 0.0 km/s, L/D:1.0 OSL: -7.976950472933822 USL: -8.093977107666433, TCW: 0.11702663473261055 EFOS: 1.0 EFUS: 1.0
Run #3 of 4: Arrival V_infty: 30.0 km/s, L/D:0.0 OSL: -14.479022156530846 USL: -14.479022156530846, TCW: 0.0 EFOS: 1.0 EFUS: 1.0
Run #4 of 4: Arrival V_infty: 30.0 km/s, L/D:1.0 OSL: -13.721204087287333 USL: -21.917360380572063, TCW: 8.19615629328473 EFOS: 1.0 EFUS: 1.0
[6]:
acc_net_g_max_array       = np.zeros((len(v0_kms_array),len(LD_array)))
stag_pres_atm_max_array   = np.zeros((len(v0_kms_array),len(LD_array)))
q_stag_total_max_array    = np.zeros((len(v0_kms_array),len(LD_array)))
heatload_max_array        = np.zeros((len(v0_kms_array),len(LD_array)))

for i in range(0,len(v0_kms_array)):
    for j in range(0,len(LD_array)):
        vehicle=Vehicle('Oberon', 1000.0, 200.0, LD_array[j], 3.1416, 0.0, 1.00, planet)
        vehicle.setInitialState(1500.0,0.0,0.0,v0_kms_array[i],0.0,overShootLimit_array[i,j],0.0,0.0)
        vehicle.setSolverParams(1E-6)

        vehicle.propogateEntry(2400.0, 0.1, 180.0)

        # Extract and save variables to plot
        t_min_os         = vehicle.t_minc
        h_km_os          = vehicle.h_kmc
        acc_net_g_os     = vehicle.acc_net_g
        q_stag_con_os    = vehicle.q_stag_con
        q_stag_rad_os    = vehicle.q_stag_rad
        rc_os            = vehicle.rc
        vc_os            = vehicle.vc
        stag_pres_atm_os = vehicle.computeStagPres(rc_os,vc_os)/(1.01325E5)
        heatload_os      = vehicle.heatload

        vehicle=Vehicle('Oberon', 1000.0, 200.0, LD_array[j], 3.1416, 0.0, 1.00, planet)
        vehicle.setInitialState(1500.0,0.0,0.0,v0_kms_array[i],0.0,underShootLimit_array[i,j],0.0,0.0)
        vehicle.setSolverParams(1E-6)

        vehicle.propogateEntry(2400.0, 0.1, 0.0)

        # Extract and save variable to plot
        t_min_us         = vehicle.t_minc
        h_km_us          = vehicle.h_kmc
        acc_net_g_us     = vehicle.acc_net_g
        q_stag_con_us    = vehicle.q_stag_con
        q_stag_rad_us    = vehicle.q_stag_rad
        rc_us            = vehicle.rc
        vc_us            = vehicle.vc
        stag_pres_atm_us = vehicle.computeStagPres(rc_us,vc_us)/(1.01325E5)
        heatload_us      = vehicle.heatload

        q_stag_total_os  = q_stag_con_os + q_stag_rad_os
        q_stag_total_us  = q_stag_con_us + q_stag_rad_us

        acc_net_g_max_array[i,j]      = max(max(acc_net_g_os),max(acc_net_g_us))
        stag_pres_atm_max_array[i,j]  = max(max(stag_pres_atm_os),max(stag_pres_atm_os))
        q_stag_total_max_array[i,j]   = max(max(q_stag_total_os),max(q_stag_total_us))
        heatload_max_array[i,j]       = max(max(heatload_os),max(heatload_us))

        print("V_infty: "+str(vinf_kms_array[i])+" km/s"+", L/D: "+str(LD_array[j])+" G_MAX: "+str(acc_net_g_max_array[i,j])+" QDOT_MAX: "+str(q_stag_total_max_array[i,j])+" J_MAX: "+str(heatload_max_array[i,j])+" STAG. PRES: "+str(stag_pres_atm_max_array[i,j]))

np.savetxt('../data/girijaSaikia2019a/'+runID+'acc_net_g_max_array.txt',acc_net_g_max_array)
np.savetxt('../data/girijaSaikia2019a/'+runID+'stag_pres_atm_max_array.txt',stag_pres_atm_max_array)
np.savetxt('../data/girijaSaikia2019a/'+runID+'q_stag_total_max_array.txt',q_stag_total_max_array)
np.savetxt('../data/girijaSaikia2019a/'+runID+'heatload_max_array.txt',heatload_max_array)
V_infty: 0.0 km/s, L/D: 0.0 G_MAX: 0.05394060815860674 QDOT_MAX: 74.06491463780053 J_MAX: 41374.247055160056 STAG. PRES: 0.0010473053416354748
V_infty: 0.0 km/s, L/D: 1.0 G_MAX: 0.08366575834728353 QDOT_MAX: 77.03205462674941 J_MAX: 42091.96352516038 STAG. PRES: 0.0010461973471433495
V_infty: 30.0 km/s, L/D: 0.0 G_MAX: 12.243125885881222 QDOT_MAX: 28618.290301651356 J_MAX: 2374794.7913468257 STAG. PRES: 0.23721295548140664
V_infty: 30.0 km/s, L/D: 1.0 G_MAX: 127.05514958454569 QDOT_MAX: 51744.90580336135 J_MAX: 3659758.2791496087 STAG. PRES: 0.0539571845570865
[7]:
N1 = pd.read_excel('../interplanetary-data/Uranus/U1.xlsx', sheet_name='Sheet1')
N2 = pd.read_excel('../interplanetary-data/Uranus/U2.xlsx', sheet_name='Sheet1')
N3 = pd.read_excel('../interplanetary-data/Uranus/U3.xlsx', sheet_name='Sheet1')
N4 = pd.read_excel('../interplanetary-data/Uranus/U4.xlsx', sheet_name='Sheet1')
N5 = pd.read_excel('../interplanetary-data/Uranus/Uranus.xlsx', sheet_name='Uranus')

TOF1 = N1['Atof'].values
TOF2 = N2['Atof'].values
TOF3 = N3['Atof'].values
TOF4 = N4['Atof'].values
TOF5 = N5['TOF'].values*365.0

VINF1 = N1['Avinf'].values
VINF2 = N2['Avinf'].values
VINF3 = N3['Avinf'].values
VINF4 = N4['Avinf'].values
VINF5 = N5['ArrVinf_mag'].values

LC31 = N1['LC3'].values
LC32 = N2['LC3'].values
LC33 = N3['LC3'].values
LC34 = N4['LC3'].values
LC35 = N5['C3'].values

TOF   = np.concatenate((TOF1, TOF2, TOF3, TOF4),axis=0)
TOF_y = TOF / 365.0

VINF_kms = np.concatenate((VINF1, VINF2, VINF3, VINF4),axis=0)

LC3 = np.concatenate((LC31,LC32,LC33, LC34),axis=0)


#plt.axhline(y=13.5,linewidth=1, linestyle='dotted' ,color='black',zorder=0)
#plt.axvline(x=13.0,linewidth=1, linestyle='dotted' ,color='black',zorder=0)

fig, axes = plt.subplots(1, 2, figsize = (6.5, 3.5))
fig.tight_layout()
plt.subplots_adjust(wspace=0.30)
plt.rc('font',family='Times New Roman')
params = {'mathtext.default': 'regular' }
plt.rcParams.update(params)

a0 = axes[0].scatter(TOF5 / 365.0, VINF5, c=LC35, cmap='jet',vmin=0, vmax=LC35.max(), zorder=10,s=5.0)
a1 = axes[0].scatter(TOF_y, VINF_kms , c=LC3, cmap='jet',vmin=0, vmax=LC35.max(), zorder=11, s=5.0)
cbar = fig.colorbar(a0, ax=axes[0])
cbar.ax.tick_params(labelsize=10)
cbar.set_label(r'$C_3, km^2/s^2$', labelpad=-27, y=1.10, rotation=0, fontsize=10)
cbar.ax.tick_params(axis='y', direction='in')

axes[0].tick_params(direction='in')
axes[0].yaxis.set_ticks_position('both')
axes[0].xaxis.set_ticks_position('both')

axes[0].set_xlabel("Time of flight (TOF), years" ,fontsize=10)
axes[0].set_ylabel("Arrival "+r'$V_{\infty}$'+', km/s',fontsize=10)

axes[0].set_yticks(np.arange(5, 26, step=5))
axes[0].set_xticks(np.arange(6, 13, step=2))

axes[0].tick_params(axis='x',labelsize=10)
axes[0].tick_params(axis='y',labelsize=10)


x = np.loadtxt('../data/girijaSaikia2019a/'+runID+'vinf_kms_array.txt')
y = np.loadtxt('../data/girijaSaikia2019a/'+runID+'LD_array.txt')

Z1 = np.loadtxt('../data/girijaSaikia2019a/'+runID+'TCW_array.txt')
G1 = np.loadtxt('../data/girijaSaikia2019a/'+runID+'acc_net_g_max_array.txt')
Q1 = np.loadtxt('../data/girijaSaikia2019a/'+runID+'q_stag_total_max_array.txt')
H1 = np.loadtxt('../data/girijaSaikia2019a/'+runID+'heatload_max_array.txt')
S1 = np.loadtxt('../data/girijaSaikia2019a/'+runID+'stag_pres_atm_max_array.txt')


f1 = interpolate.interp2d(x, y, np.transpose(Z1), kind='cubic')
g1 = interpolate.interp2d(x, y, np.transpose(G1), kind='cubic')
q1 = interpolate.interp2d(x, y, np.transpose(Q1), kind='cubic')
h1 = interpolate.interp2d(x, y, np.transpose(H1), kind='cubic')
s1 = interpolate.interp2d(x, y, np.transpose(S1), kind='cubic')


x_new =  np.linspace( 0.0,   30,  110)
y_new =  np.linspace( 0.0,   1.0 ,110)
z_new =  np.zeros((len(x_new),len(y_new)))

z1_new =  np.zeros((len(x_new),len(y_new)))
g1_new =  np.zeros((len(x_new),len(y_new)))
q1_new =  np.zeros((len(x_new),len(y_new)))
h1_new =  np.zeros((len(x_new),len(y_new)))
s1_new =  np.zeros((len(x_new),len(y_new)))

for i in range(0,len(x_new)):
    for j in range(0,len(y_new)):

        z1_new[i,j] = f1(x_new[i],y_new[j])
        g1_new[i,j] = g1(x_new[i],y_new[j])
        q1_new[i,j] = q1(x_new[i],y_new[j])
        h1_new[i,j] = h1(x_new[i],y_new[j])
        s1_new[i,j] = s1(x_new[i],y_new[j])


Z1 = z1_new
G1 = g1_new
Q1 = q1_new
S1 = s1_new
H1 = h1_new/1000.0

X, Y = np.meshgrid(x_new, y_new)

Zlevels = np.array([0.5,1.0,1.5,2.0])
Glevels = np.array([30.0])
Qlevels = np.array([8000.0])
Hlevels = np.array([700.0])
Slevels = np.array([1.0])


ZCS1 = axes[1].contour(X, Y, np.transpose(Z1), levels=Zlevels, colors='black')

plt.clabel(ZCS1, inline=1, fontsize=10, colors='black',fmt='%.1f',inline_spacing=1)
ZCS1.collections[0].set_linewidths(1.0)
ZCS1.collections[1].set_linewidths(1.0)
ZCS1.collections[2].set_linewidths(1.0)
ZCS1.collections[3].set_linewidths(1.0)
ZCS1.collections[0].set_label(r'$TCW, deg$')


GCS1 = axes[1].contour(X, Y, np.transpose(G1), levels=Glevels, colors='blue', linestyles='dashed')

plt.clabel(GCS1, inline=1, fontsize=10, colors='blue',fmt='%d')
GCS1.collections[0].set_linewidths(1.0)
GCS1.collections[0].set_label(r'$Peak$'+ r' '+r'$g$'+r'-load')


QCS1 = axes[1].contour(X, Y, np.transpose(Q1), levels=Qlevels, colors='red',linestyles='dotted')

plt.clabel(QCS1, inline=1, fontsize=10, colors='red',fmt='%d')
QCS1.collections[0].set_linewidths(1.0)
QCS1.collections[0].set_label(r'$Peak$'+r' '+r'$\dot{q}$'+', '+r'$W/cm^2$')


HCS1 = axes[1].contour(X, Y, np.transpose(H1), levels=Hlevels, colors='magenta', linestyles='dashdot')
plt.xlim([0.0,30.0])
plt.clabel(HCS1, inline=1, fontsize=10, colors='magenta',fmt='%d',inline_spacing=1)
HCS1.collections[0].set_linewidths(1.0)
HCS1.collections[0].set_label(r'$Heat$'+' '+r'$ load, kJ/cm^2$')


SCS1 = axes[1].contour(X, Y, np.transpose(S1), levels=Slevels, colors='xkcd:emerald green', linestyles='dashed')
plt.xlim([0.0,30.0])
plt.clabel(SCS1, inline=1, fontsize=10, colors='xkcd:emerald green',fmt='%.1f',inline_spacing=1)
SCS1.collections[0].set_linewidths(1.0)
SCS1.collections[0].set_label(r'$Peak$'+r' '+'stag. pres., bar')

for c in SCS1.collections:
    c.set_dashes([(0.5, (7.0, 2.0))])

axes[1].tick_params(direction='in')
axes[1].yaxis.set_ticks_position('both')
axes[1].xaxis.set_ticks_position('both')

#axes[1].set(xlabel="Exam score-1", ylabel="Exam score-2")

axes[1].set_xlabel("Arrival "+r'$V_{\infty}$'+r', km/s' ,fontsize=10)
axes[1].set_ylabel("L/D",fontsize=10)

axes[1].tick_params(axis='x',labelsize=10)
axes[1].tick_params(axis='y',labelsize=10)


legend1 = axes[1].legend(loc='lower left', fontsize=8, frameon=False)


dat0 = ZCS1.allsegs[3][0]
x1,y1=dat0[:,0],dat0[:,1]
F1 = interpolate.interp1d(x1, y1, kind='linear',fill_value='extrapolate', bounds_error=False)

dat1 = GCS1.allsegs[0][0]
x2,y2=dat1[:,0],dat1[:,1]
F2 = interpolate.interp1d(x2, y2, kind='linear',fill_value='extrapolate', bounds_error=False)

dat2 = HCS1.allsegs[0][0]
x3,y3= dat2[:,0],dat2[:,1]
F3 = interpolate.interp1d(x3, y3, kind='linear',fill_value='extrapolate', bounds_error=False)


x4 = np.linspace(0,30,301)
y4 = F1(x4)
y5 = F2(x4)
y6 = F3(x4)

y7 = np.minimum(y5,y6)

plt.fill_between(x4, y4, y7, where=y4<=y7,color='xkcd:neon green')

dat0 = ZCS1.allsegs[2][0]
x1,y1=dat0[:,0],dat0[:,1]
F1 = interpolate.interp1d(x1, y1, kind='linear',fill_value='extrapolate', bounds_error=False)

dat1 = ZCS1.allsegs[3][0]
x2,y2=dat1[:,0],dat1[:,1]
F2 = interpolate.interp1d(x2, y2, kind='linear',fill_value='extrapolate', bounds_error=False)

dat2 = HCS1.allsegs[0][0]
x3,y3= dat2[:,0],dat2[:,1]
F3 = interpolate.interp1d(x3, y3, kind='linear',fill_value='extrapolate', bounds_error=False)


x4 = np.linspace(0,30,301)
y4 = F1(x4)
y5 = F2(x4)
y6 = F3(x4)

y7 = np.minimum(y5,y6)

plt.fill_between(x4, y4, y7, where=y4<=y7,color='xkcd:bright yellow')
plt.xlim([0.0,30.0])
plt.ylim([0.0,1.0])

plt.savefig('../plots/girijaSaikia2019a.png',bbox_inches='tight')
plt.savefig('../plots/girijaSaikia2019a.pdf', dpi=300,bbox_inches='tight')
plt.savefig('../plots/girijaSaikia2019a.eps', dpi=300,bbox_inches='tight')

plt.show()
[9]:
from IPython.display import Image
Image(filename='../plots/girijaSaikia2019a-high-res.png', width=800)
[9]: