years = DATA['Year'].values
years_ve = years
years_ea = years
years_ma = years
years_ti = years
years_ur = years
years_ne = years
years_ge = years
years_ju = years
years_sa = years
ve_index_to_remove=np.array([0])
ea_index_to_remove=np.array([0])
ma_index_to_remove=np.array([0])
ti_index_to_remove=np.array([0])
ur_index_to_remove=np.array([0])
ne_index_to_remove=np.array([0])
ge_index_to_remove=np.array([0])
ju_index_to_remove=np.array([0])
sa_index_to_remove=np.array([0])
for i in range(0,len(years)):
if tclass[i] != 'Venus':
ve_index_to_remove=np.append(ve_index_to_remove,i)
for i in range(0,len(years)):
if tclass[i] != 'Earth':
ea_index_to_remove=np.append(ea_index_to_remove,i)
for i in range(0,len(years)):
if tclass[i] != 'Mars':
ma_index_to_remove=np.append(ma_index_to_remove,i)
for i in range(0,len(years)):
if tclass[i] != 'Titan':
ti_index_to_remove=np.append(ti_index_to_remove,i)
for i in range(0,len(years)):
if tclass[i] != 'Uranus':
ur_index_to_remove=np.append(ur_index_to_remove,i)
for i in range(0,len(years)):
if tclass[i] != 'Neptune':
ne_index_to_remove=np.append(ne_index_to_remove,i)
for i in range(0,len(years)):
if tclass[i] != 'Generic':
ge_index_to_remove=np.append(ge_index_to_remove,i)
'''
for i in range(0,len(years)):
if tclass[i] != 'Jupiter':
ju_index_to_remove=np.append(ju_index_to_remove,i)
for i in range(0,len(years)):
if tclass[i] != 'Saturn':
sa_index_to_remove=np.append(sa_index_to_remove,i)
'''
ve_index_to_remove=np.delete(ve_index_to_remove,0)
ea_index_to_remove=np.delete(ea_index_to_remove,0)
ma_index_to_remove=np.delete(ma_index_to_remove,0)
ti_index_to_remove=np.delete(ti_index_to_remove,0)
ur_index_to_remove=np.delete(ur_index_to_remove,0)
ne_index_to_remove=np.delete(ne_index_to_remove,0)
ge_index_to_remove=np.delete(ge_index_to_remove,0)
#ju_index_to_remove=np.delete(ju_index_to_remove,0)
#sa_index_to_remove=np.delete(sa_index_to_remove,0)
years_ve = np.delete(years_ve, ve_index_to_remove)
years_ea = np.delete(years_ea, ea_index_to_remove)
years_ma = np.delete(years_ma, ma_index_to_remove)
years_ti = np.delete(years_ti, ti_index_to_remove)
years_ur = np.delete(years_ur, ur_index_to_remove)
years_ne = np.delete(years_ne, ne_index_to_remove)
years_ge = np.delete(years_ge, ge_index_to_remove)
#years_ju = np.delete(years_ju, ju_index_to_remove)
#years_sa = np.delete(years_sa, sa_index_to_remove)
#years_st = [years_ve, years_ea, years_ma, years_ju, years_sa, years_ti, years_ur, years_ne, years_ge]
years_st = [years_ve, years_ea, years_ma, years_ti, years_ur, years_ne, years_ge]
fig=plt.figure(figsize=(6.5,3.25))
rcParams['font.family'] = 'sans-serif'
rcParams['font.sans-serif'] = ['DejaVu Sans']
params = {'mathtext.default': 'regular' }
plt.rcParams.update(params)
plt.style.use('dark_background')
plt.rcParams.update(plt.rcParamsDefault)
colors = ['xkcd:light orange', 'xkcd:rust', 'xkcd:red orange', 'xkcd:sunshine yellow', 'xkcd:bright sea green', 'xkcd:cerulean blue', 'xkcd:grey']
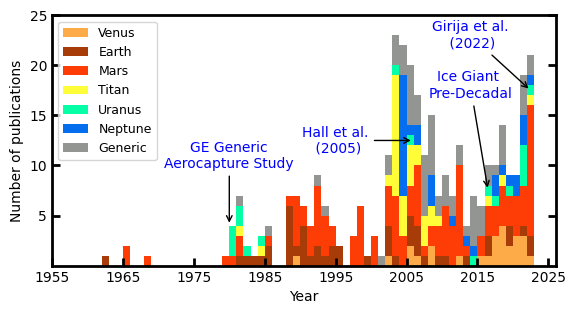
plt.hist(years_st, bins=np.arange(min(years), max(years)+2, 1), stacked=True, label=['Venus', 'Earth', 'Mars','Titan', 'Uranus', 'Neptune', 'Generic'],color=colors)
plt.xlabel('Year', fontsize=10)
plt.ylabel('Number of publications',fontsize=10);
plt.xticks(np.arange(1955, max(years) + 10, 10))
plt.yticks(np.arange(5, 25 + 1, 5))
plt.xticks(fontsize=10)
plt.yticks(fontsize=10)
ax = plt.gca()
ax.tick_params(direction='in')
ax.yaxis.set_ticks_position('both')
plt.annotate("GE Generic\nAerocapture Study" , xy=(1980, 4), xytext=(1980, 11), va="center", ha="center", arrowprops=dict(arrowstyle='->, head_width=0.2', facecolor='blue'), fontsize=10,color='blue',bbox=dict(boxstyle='round,pad=0.2', fc='none', ec='none', alpha=0.3))
plt.annotate("Hall et al.\n (2005)" , xy=(2006, 12.5), xytext=(1995,12.5), va="center", ha="center", arrowprops=dict(arrowstyle='->, head_width=0.2', facecolor='blue'), fontsize=10,color='blue',bbox=dict(boxstyle='round,pad=0.2', fc='none', ec='none', alpha=0.3))
plt.annotate("Ice Giant \nPre-Decadal" , xy=(2016.5, 7.5), xytext=(2014,18), va="center", ha="center", arrowprops=dict(arrowstyle='->, head_width=0.2', facecolor='blue'), fontsize=10,color='blue',bbox=dict(boxstyle='round,pad=0.2', fc='none', ec='none', alpha=0.3))
plt.annotate("Girija et al.\n (2022)" , xy=(2022.5, 17.5), xytext=(2014,23), va="center", ha="center", arrowprops=dict(arrowstyle='->, head_width=0.2', facecolor='blue'), fontsize=10,color='blue',bbox=dict(boxstyle='round,pad=0.2', fc='none', ec='none', alpha=0.3))
#plt.xlim([1958,2027])
#plt.annotate("Neptune aerocapture studies \n (Lockwood et al., 2006)" , xy=(2004.5, 15.0), xytext=(1988, 15.0), va="center", ha="center", arrowprops=dict(width=0.3, facecolor='black', edgecolor='black', shrink=0.05, headwidth=4.0), fontsize=9,color='black',bbox=dict(boxstyle='round,pad=0.2', fc='none',ec='none', alpha=0.3))
#plt.annotate("PSD assessment \n (Spilker et al., 2016) \n \n Aerocapture \n assessment \n (Saikia et al., 2016)" , xy=(2017.5, 8.6), xytext=(2017.5, 18.0), va="center", ha="center", arrowprops=dict(width=0.3, facecolor='black', edgecolor='black', shrink=0.05, headwidth=4.0), fontsize=9,color='black',bbox=dict(boxstyle='round,pad=0.2', fc='none',ec='none', alpha=0.3))
ax = plt.gca()
ax.tick_params(direction='in')
plt.legend(loc='upper left', fontsize=9)
ax.xaxis.set_tick_params(width=2)
ax.yaxis.set_tick_params(width=2)
ax.tick_params(length=6)
for axis in ['top','bottom','left','right']:
ax.spines[axis].set_linewidth(2)
plt.savefig('../plots/hist-byPlanet-may-28.png',bbox_inches='tight')
plt.savefig('../plots/hist-byPlanet-may-28.pdf', dpi=500,bbox_inches='tight')
plt.savefig('../plots/hist-byPlanet-may-28.eps', dpi=500,bbox_inches='tight')
plt.show()